...
Which displays are used in the IFD?
The IFD ( Interactive Forecasting Displays (IFD) consists of several panels. Each of these panels , each has a specific role in the process of creating a forecast with the IFD. In this chapter the functionality of each panel in the IFD will be explained.
In chapter Section How to create a forecast with the IFD will be explained with contains a use case to explain how a forecast can be created with the IFD by using the combined functionality of the separate the IFD and its panels.
Forecast panel

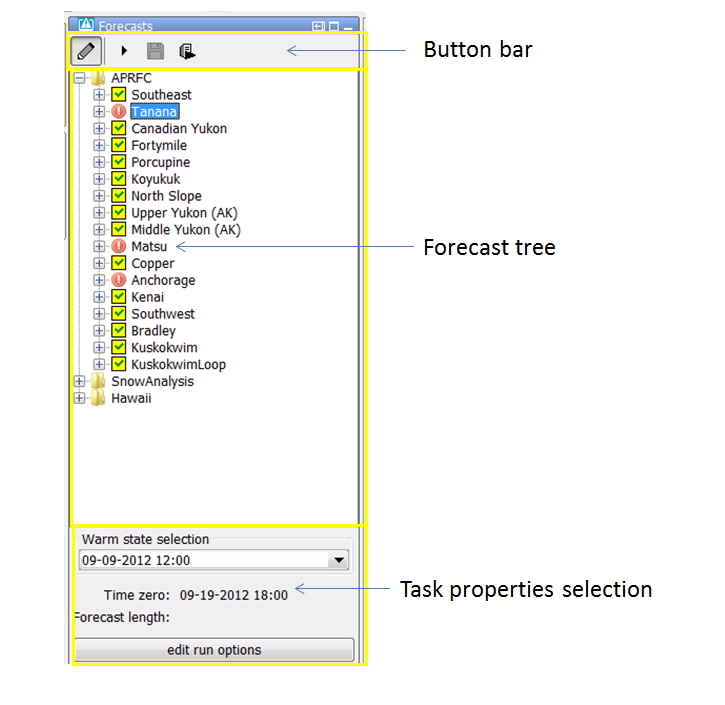
The forecast panel (indicated in yellow rectangle above) plays a central role in creating a forecast in the IFD. The forecast panel It shows a tree with all the forecast points for a region and a logical grouping of these forecast points. It is also possible to show can be set up to structure the work process of a forecaster in the forecast panel. The forecast panel consists of three main sections each of them will be explained in detail in the coming sections.
Button bar
: button bar; forecast tree and icons; and task properties panel.
Button bar
The top of the forecast panel shows a button bar. By default this button bar will look like this. In the table below the The buttons are explained in more detail in the table below.
![]()
| Icon | Action | Visible | Enabled (not greyed out) | Available since |
|---|---|---|---|---|
| Switches to IFD between read-only mode and edit-mode | when <enableAutoRun> is true | always | |
 | Starts the workflow of the node in IFD-mode (as local run, runs in the Operator Client)). | always | when the node has <localRun> set to true, and | |
 | promotes a local IFD run to a server run. | always | when the node has an IFD-run and when <saveLocalRunEnabled> is set to true. | |
 | starts a workflow in server mode. | always | when the node has <localRun> set to false, or | |
 | starts the secondary workflow of the selected node | when a secondary workflow is configured | when a node with a secondary workflow is selected | 2018.01 |
| If the button is selected the threshold icons will be shown instead of the regular run status icons | by default, unless <hideThresholdsButton> is true | always | 2019.02 |
| If this button is selected a modifier icon will be shown for a topology node if active modifiers are visible in the modifiers panel if that topology node is selected. This means that if you disable for a topology node that modifiers are visible in the modifiers panel that the modifier icon will also not be visible. | by default, unless <hideModifiersButton> is true | always | 2020.01 |

Original button bar (6 buttons)
AlternativelyOptionally, your Delft-FEWS application can be set up to show the original button bar with 6 buttons. The table below only includes the buttons that are different to from the new (default) button bar (above)are described in the table below.

| Icon | Action | Visible | Enabled |
|---|---|---|---|
 | step to the next leaf node in the topology tree | always | always |
 | start a workflow in IFD mode | always | when the node has <localRun> set to true |
 | start all the workflows of the children of the group node in IFD-mode | always | when a group node is selected |
 | updates the system time to the current time. | always | always |
...
The majority of these settings can be adjusted in the bottom section of the panel (left screenshot). More options are available in the panel which can be started by clicking on behind the "edit run options" button (right screenshot).
The initial state selection, time zero and forecast length which are set directly after selecting a node can be determined by the configuration . The page (see 24 Topology describes which for these configuration options are available).


Local and server runs
The philosophy: Local runs are used by the operator to interactively run a workflow on the operator client, check the results and potentially optimize a forecast by means of modifiers. Once the operator is satisfied with the forecast results, a server run is started and the results can be shared between operators. Local runs will not store any time series in the central Delft-FEWS database, only time series from server runs are stored in the central database.
...
Modifiers panel
The modifiers panel is an important display in the IFDallows you to create, modify or delete modifiers. It shows the modifiers which are created for the selected node in the forecast panel or (since 2019.02) the modifiers linked to the the node selected in the IFD, or modifiers for the grid plot on for which spatial modifier mode has been activated . Modifiers can be created, modified or deleted in this panel.(since 2019.02).
The top part lists The upper part of the display gives an overview of the modifiers created for the currently selected node in the forecaster panel. When a modifier is selected in this panel, the details will be shown in the lower part of the panel. It also allows the user to make modifiers active and inactive with the checkbox in the column Active. When a modifier is made locally, it get's a salmon background color. When it is saved to the server (by running the associated WF on the server), it gets a green background color.(modifier table). It allows you to (in)activate, delete and copy modifiers (see below). Modifiers for a local run have a salmon background color. Modifiers for server runs have a green background and are saved to the server.
The bottom part shows the details of a selected modifier (modifier editor).
The splitter between the overview and the editor is stored in user_settings.ini. When the application is reopened, the splitter appears at the previously set position.
- Activate - Use check box to (de-)activate a modifier
- Delete - Use cross button to delete a modifier.Delete - A modifier can be deleted by pressing the cross icon.
- If you have made a local change to a saved modifier, only the local change will be deleted
- and the background will change
- from salmon to green. If you delete it again, the
- server modifier will be deleted as well.
- (Note, in a SA the behavior is different.
- Here a
- single delete action deletes the entire modifier.)
- The Run Info panel
- shows both the server and local modifiers, so you can compare them directly.
This panel needs to be enabled, see How to define an ExplorerTask - what are the possible taskClass options?
- Copy - Use copy button to copy Copy - The copy-icon copies the modifier.
Splitter - The position of the splitter between the table and the editor is stored in user_settings.ini. When the application is reopened, the splitter appears at the previously set position.

Spatial display
...
and modifiers
There are spatial modifier types Since 2019.02, there are modifier types which are used to modify grid time series . These spatial modifiers need to be (since 2019.02), which are created through the spatial display instead of the modifiers panel. More information on how to create spatial modifiers in the spatial display is found at See User Guide > 05 Spatial Display > Creating Spatial Modifiers.
...
The topology panel shows the topology of the children of selected node, both when nodes linked to a selected node, highlighting the box of the selected node.
- The panel shows the topology, whether you select the parent node
...
- or a child node.
- Reversely, you can select a node in the Forecast panel by clicking on a box in the Topology panel.
- The connections are based on the Topology (nodes and previousNodeIds
...
- ) and is not
...
- influenced by the
...
- workflows linked to those nodes
...
- .
- The colors of the boxes correspond to threshold crossings, as configured in 09 Thresholds.
This panel needs to be enabled, see
The colors of the boxes in the topology correspond to threshold crossings. The color of the box and the thresholds which are monitored are configurable in the threshold module of Delft-FEWS.
You enable the TopologyPanel in the Explorer.xml, see How to define an ExplorerTask - what are the possible taskClass options?

Plot display
DisplayGroup
The plot display is used to show scalar time series. A topology node can be connected to a display group. When a topology node is selected and there is a display group connected to this node then the first plot of that display group Display Group. If this is the case, the first plot in this displayGroup will be shown automatically . If there is already a node selected then when the corresponding topology node is selected. If you switch between nodes with linked displayGroups Delft-FEWS will first try to find instead show a plot with the same location and parameter as currently displayed if that is not possible then the first plot will be displayed.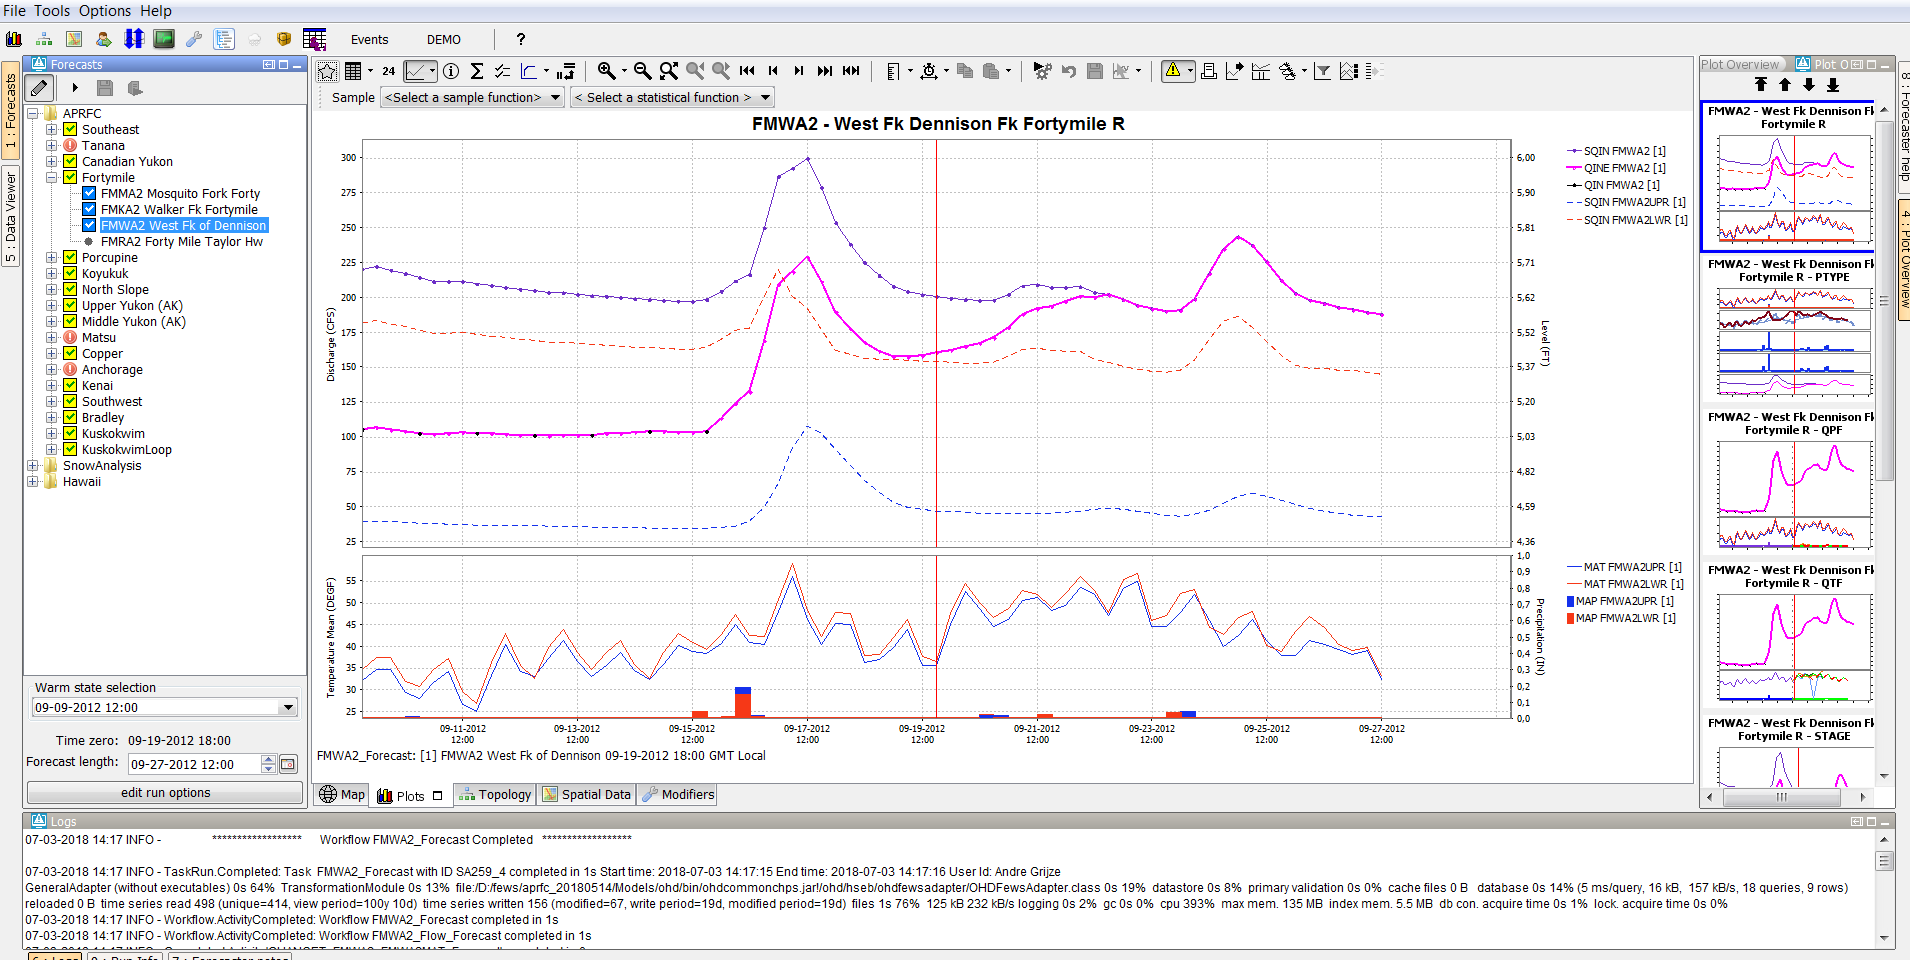 if available.
Plot display
Delft-FEWS When the IFD is started, there is always at least one plot display available. This plot is called the , the so-called primary plot display. The primary plot , which doesn't have lock icon at the left of in the toolbar.
When a new an additional plot display is started this plot opened, it will have a lock icon at in the left on the toolbar. When a new plot displayed is started, by toolbar (see yellow indication below). By default the plot will be locked. The lock icon is indicated in yellow in the image below.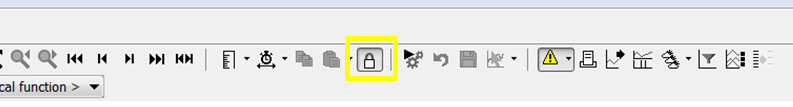 When a plot is locked, the display is locked to that set of time series. When the forecaster selects is locked, which means it is locked to that time series shown. When you select another node, the plot will continue to display the original time series and will not change . However when new data is brought in, the plot is updated with new data. When the toggle-button is switched off (icon changes to unlock) the plot window is updated automatically when a new node is selected.
Plot overview
The plot overview is a panel which shows a thumbnail of each plot which is configured for the selected node. This panel gives an overview of the selected node. When a plot is selected the primary plot is automatically updated, also other plots display which are not locked (see previous chapter) are updated.

...
Forecaster help (aka Document Viewer)
The forecaster aid document panel (or document viewer) displays (user provided) documents linked to nodes in the Topology. The following formats are supported: text-files, images and pdf-files.
...
accordingly. The timeseries shown will however update if new data for those series comes available.
Plot overview
The plot overview is a panel which shows a thumbnail of each plot of the displayGroup linked to the selected node. If you select a thumbnail, the primary plot display is automatically updated, as are other unlocked plots display (see above).
The 4 buttons at the top of Plot Overview can be used to select the first, the previous, the next plot and the last plot respectively.
Forecaster aid selection panel and Document Viewer
The forecaster aid selection panel is a tool window that provides a list documents that can be viewed in the Document Viewer, which is a main panel (see screenshots below).
The content of the selection panel depends on which node is selected in the Topology, and is updated automatically when a different node is selected.
- The documents are organized in (sub)directories, configured in the topology.xml as a
...
- <forecasterHelperDirectories>, see section below.
- Nodes with the same id as the (sub)directory name will display the documents in that (sub)folder.
- If you make use sub-folders, make sure to also include the main folder as a directory when you list the <forecasterHelperDirectories>.
- Documents in the folder configured as <allNodesDirectory> will be visible at all nodes.
- The
...
- following formats are supported:
- text-files,
- images and
- pdf-files.
- These can be documents that are
- part of the configuration (e.g. user guide),
...
- placed there by users for easy access, or
- created by the report module of Delft-FEWS
...
- a list of reports based on an explorer location document attribute (since 2017.02)
ForecasterHelperDirectories examples
We first give an example of forecasterHelperDirectories configured in Topology.xml using <directory>.
Next we show how to link directories to multiple nodes with <multipleNodesDirectory>. Any node which id starts with the <nodeIdPrefix> will be linked to that particular documents folder.
Note: If <forecasterHelperDirectories> is not configured, the INFORMATION_PANEL_FOLDER property defined in the global.properties will be used instead.
| Code Block |
|---|
For instance:
| Code Block | ||||
|---|---|---|---|---|
| ||||
<forecasterHelperDirectories> <directory>d:\Data\ForecasterHelperData\</directory> <directory>d:\Data\FHD3\</directory> <directory>$DOCUMENTS_ROOT_FOLDER$</directory> <directory>$DOCUMENTS_ROOT_FOLDER$/subfolder_1/</directory> <directory>$DOCUMENTS_ROOT_FOLDER$/subfolder_2</directory> <allNodesDirectory>$DOCUMENTS_ALWAYSVISIBLE_FOLDER$</allNodesDirectory> </forecasterHelperDirectories> |
You can also link directories to multiple nodes, by making use of the <multipleNodesDirectory> element. Any node which id starts with the <nodeIdPrefix> will be linked to that particular documents folder.
| Code Block | ||||
|---|---|---|---|---|
| ||||
| Code Block | ||||
| ||||
<forecasterHelperDirectories> <directory>$DOCUMENTS_ROOT_FOLDER$</directory> <allNodesDirectory>$DOCUMENTS_ALWAYSVISIBLE_FOLDER$</allNodesDirectory> <multipleNodesDirectory nodeIdPrefix="Archive">$DOCUMENTS_ARCHIVE_FOLDER$</multipleNodesDirectory> <multipleNodesDirectory nodeIdPrefix="Configuration">$DOCUMENTS_CONFIGURATION_FOLDER$</multipleNodesDirectory> </forecasterHelperDirectories> <...> <node id="ArchiveTo_flood_Config" name="Archive Config to local disk"> <workflowId>Export_ToArchive_FloodOps_Config</workflowId> <filterId>Parameter_FloodOps</filterId> <toolWindow>document selection panel</toolWindow> </node> |
If the forecasterHelperDirectories is not configured, the INFORMATION_PANEL_FOLDER property defined in the global.properties will be used instead.
Configuration of document panels
The Forecaster aid selection To add the Forecaster help panel and document viewer to the Delft-FEWS explorer, please add the following tasks to need to be configured as explorerTasks in Explorer.xml. The <predefinedDisplay> "documents" (or taskClass ForecasterAidDocumentPanel) is the main window, which displays the content of the documents in the explorer. The ForecasterAidSelectionPanel is a so called toolwindow, displaying a list of all available documents (in the folder linked to the node). The content of this Selection panel depends on which node is selected in the Topology, and is updated automatically when a different node is selected.
| Code Block | ||||
|---|---|---|---|---|
| ||||
<explorerTask name | ||||
| Code Block | ||||
| ||||
<explorerTask name="Document Viewer">
	<predefinedDisplay>documents</predefinedDisplay>
</explorerTask>

<explorerTask name="Forecaster help">
	<taskClass>nl.wldelft.fews.gui.plugin.information.ForecasterAidSelectionPanel</taskClass>
</explorerTask> |
...
| Code Block | ||||
|---|---|---|---|---|
| ||||
<explorerTask name="Documents viewer">
	<taskClass>nl.wldelft.fews.gui.plugin.information.ForecasterAidDocumentPanel</taskClass>
</explorerTask>

<explorerTask name="Forecaster help">
	<taskClass>nl.wldelft.fews.gui.plugin.information.ForecasterAidSelectionPanel</taskClass>
</explorerTask> |
Example of document panels
Below an example of the tool window forecaster help (in this case renamed to: "HowTo Overview"). In this example the forecaster has 15 documents available for information. If multiple directories are configured this window will show all available files for the node from the different predefined directories together. 
When one of the files is selected in this panel the content of the selected file is shown in the document Below an example of the tool window forecaster help (in this case: renamed to: "HowTo Overview"). In this example the forecaster has 15 documents available for information. If multiple directories are configured this window will show all available files for the node from the different predefined directories together. When one of the files is selected in this panel the content of the selected file is shown in the document viewer display. The document viewer is a dockable window in the centre of the Delft-FEWS Operator Client (or SA) GUI.
...
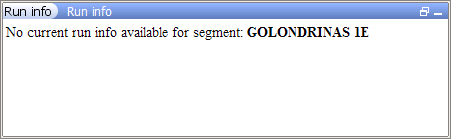
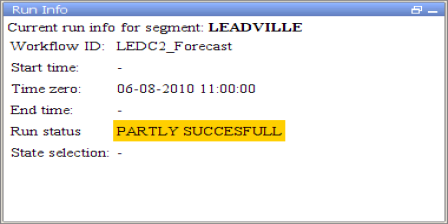
The run info panel shows detail information of the latest run of the workflow of the selected node. If
This panel needs to be enabled, see How to define an ExplorerTask - what are the possible taskClass options?
- (1st screenshot) If the workflow of the node has not run yet for the current T0 then the panel will show that there is no current run info available
...
- .
- (2nd screenshot) When the workflow has run. The status can either be successful, failed or partly successful.
...
- Only when the workflow was successful than the icon of that node will be set to green. The run status will be shown green in the run info box.
...
- (3rd screenshot) When the run is partly successful the icon of that node will be set to the red exclamation mark, the run status box in the run info panel will be set to yellow. When the run is failed the icon of the node will be set to the red exclamation
...
- mark, the run status box will be set to red.

Forecaster notes
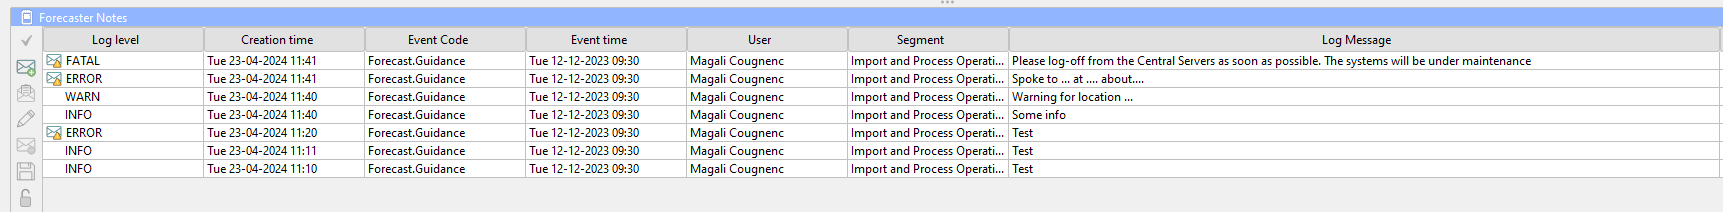
The forecaster notes panel is a toolwindow that shows notes you or other forecaster have created regarding their previous forecasts for the forecast point.
- All fields in this display can be filtered by clicking the cells.
- Each line in this display represents an unique message.
- Messages with level ERROR and FATAL have an envelope icon to indicate if message is new (open) or unacknowledged (closed).
- ‘Acknowledged message’ button: removes the envelope icon.
- Messages with level WARN and INFO do not have this functionality.
- ‘Open message’ button: opens the content of the message.
‘Add message’ button: create a new message in a pop-up window, where you can enter or select the relevant information.
Event time (default is current system time)
Log Level
User (default is current user)
Event Code and
Log Template (can be used to assist the forecaster when writing a new message).
'Add': The new message will be synchronized to the server side and from there to the other users.
A message can be linked to a node in the Forecasts display, by selecting this node before you add the message.
If no node is selected, the message is always visible.All messages are also visible in the the Forecaster Notes tab of the System Monitor display. This tab allows querying of the messages.
- An envelope icon in the status bar of the Explorer indicates a new message has arrived.

Configuration of Forecaster Notes
| Code Block | ||||||||
|---|---|---|---|---|---|---|---|---|
| ||||||||
<explorerTask name="Forecast Notes">
      <displayConfigFileName>ForecasterNotesDisplay</displayConfigFileName>
      <toolbarTask>false</toolbarTask>
      <menubarTask>false</menubarTask>
      <toolWindow>true</toolWindow>
      <loadAtStartup>true</loadAtStartup>
</explorerTask> |
| Code Block | ||||||||
|---|---|---|---|---|---|---|---|---|
| ||||||||
<forecasterNotesDisplay xmlns="http://www.wldelft.nl/fews" xmlns:xsi="http://www.w3.org/2001/XMLSchema-instance" xsi:schemaLocation="http://www.wldelft.nl/fews http://fews.wldelft.nl/schemas/version1.0/forecasterNotesDisplay.xsd">
	<title>Forecaster Notes</title>
	<msgTemplate id="Spoke to .... at .... about...">
		<message>Spoke to .... at .... about....</message>
	</msgTemplate>
	<eventCode id="Event.info"/>
	<eventCode id="Model.info"/>
	<eventCode id="Forecast.info"/>
	<eventCode id="System.maintenance"/>
</forecasterNotesDisplay> |
Forecaster notes
The forecaster notes panel shows the notes other forecaster have created regarding their previous forecasts for the forecast point. Forecasters can also created their own note and publish them. The display is located at the bottom of the Explorer. All fields in this display can be filtered by clicking the cells.
Each line in this display represents an unique message. For messages with level ERROR and FATAL, an envelope icon at the beginning indicates whether message is new (open) or unacknowledged (closed). After clicking the ‘Acknowledged message’ button on the left side of the display, the icon disappears. Messages with level WARN and INFO do not have this functionality. The content of the message can be enlarged when clicking the ‘Open message’ button. The same icon is available in the status bar of the Delft-FEWS Explorer, to indicate new messages have arrived.
To add a new message, click the ‘Add message’ button. In the pop-up window, the Event time can be entered, the Log Level selected, as well as a User, Event Code and a Log Template. By default the Current system time is entered as well as the user name. The Log template can be used to assist the forecaster with a new message. The message will be synchronized to the server side and from there to the other users.
...
How to create a forecast with the IFD
...