...
Components of spatial display
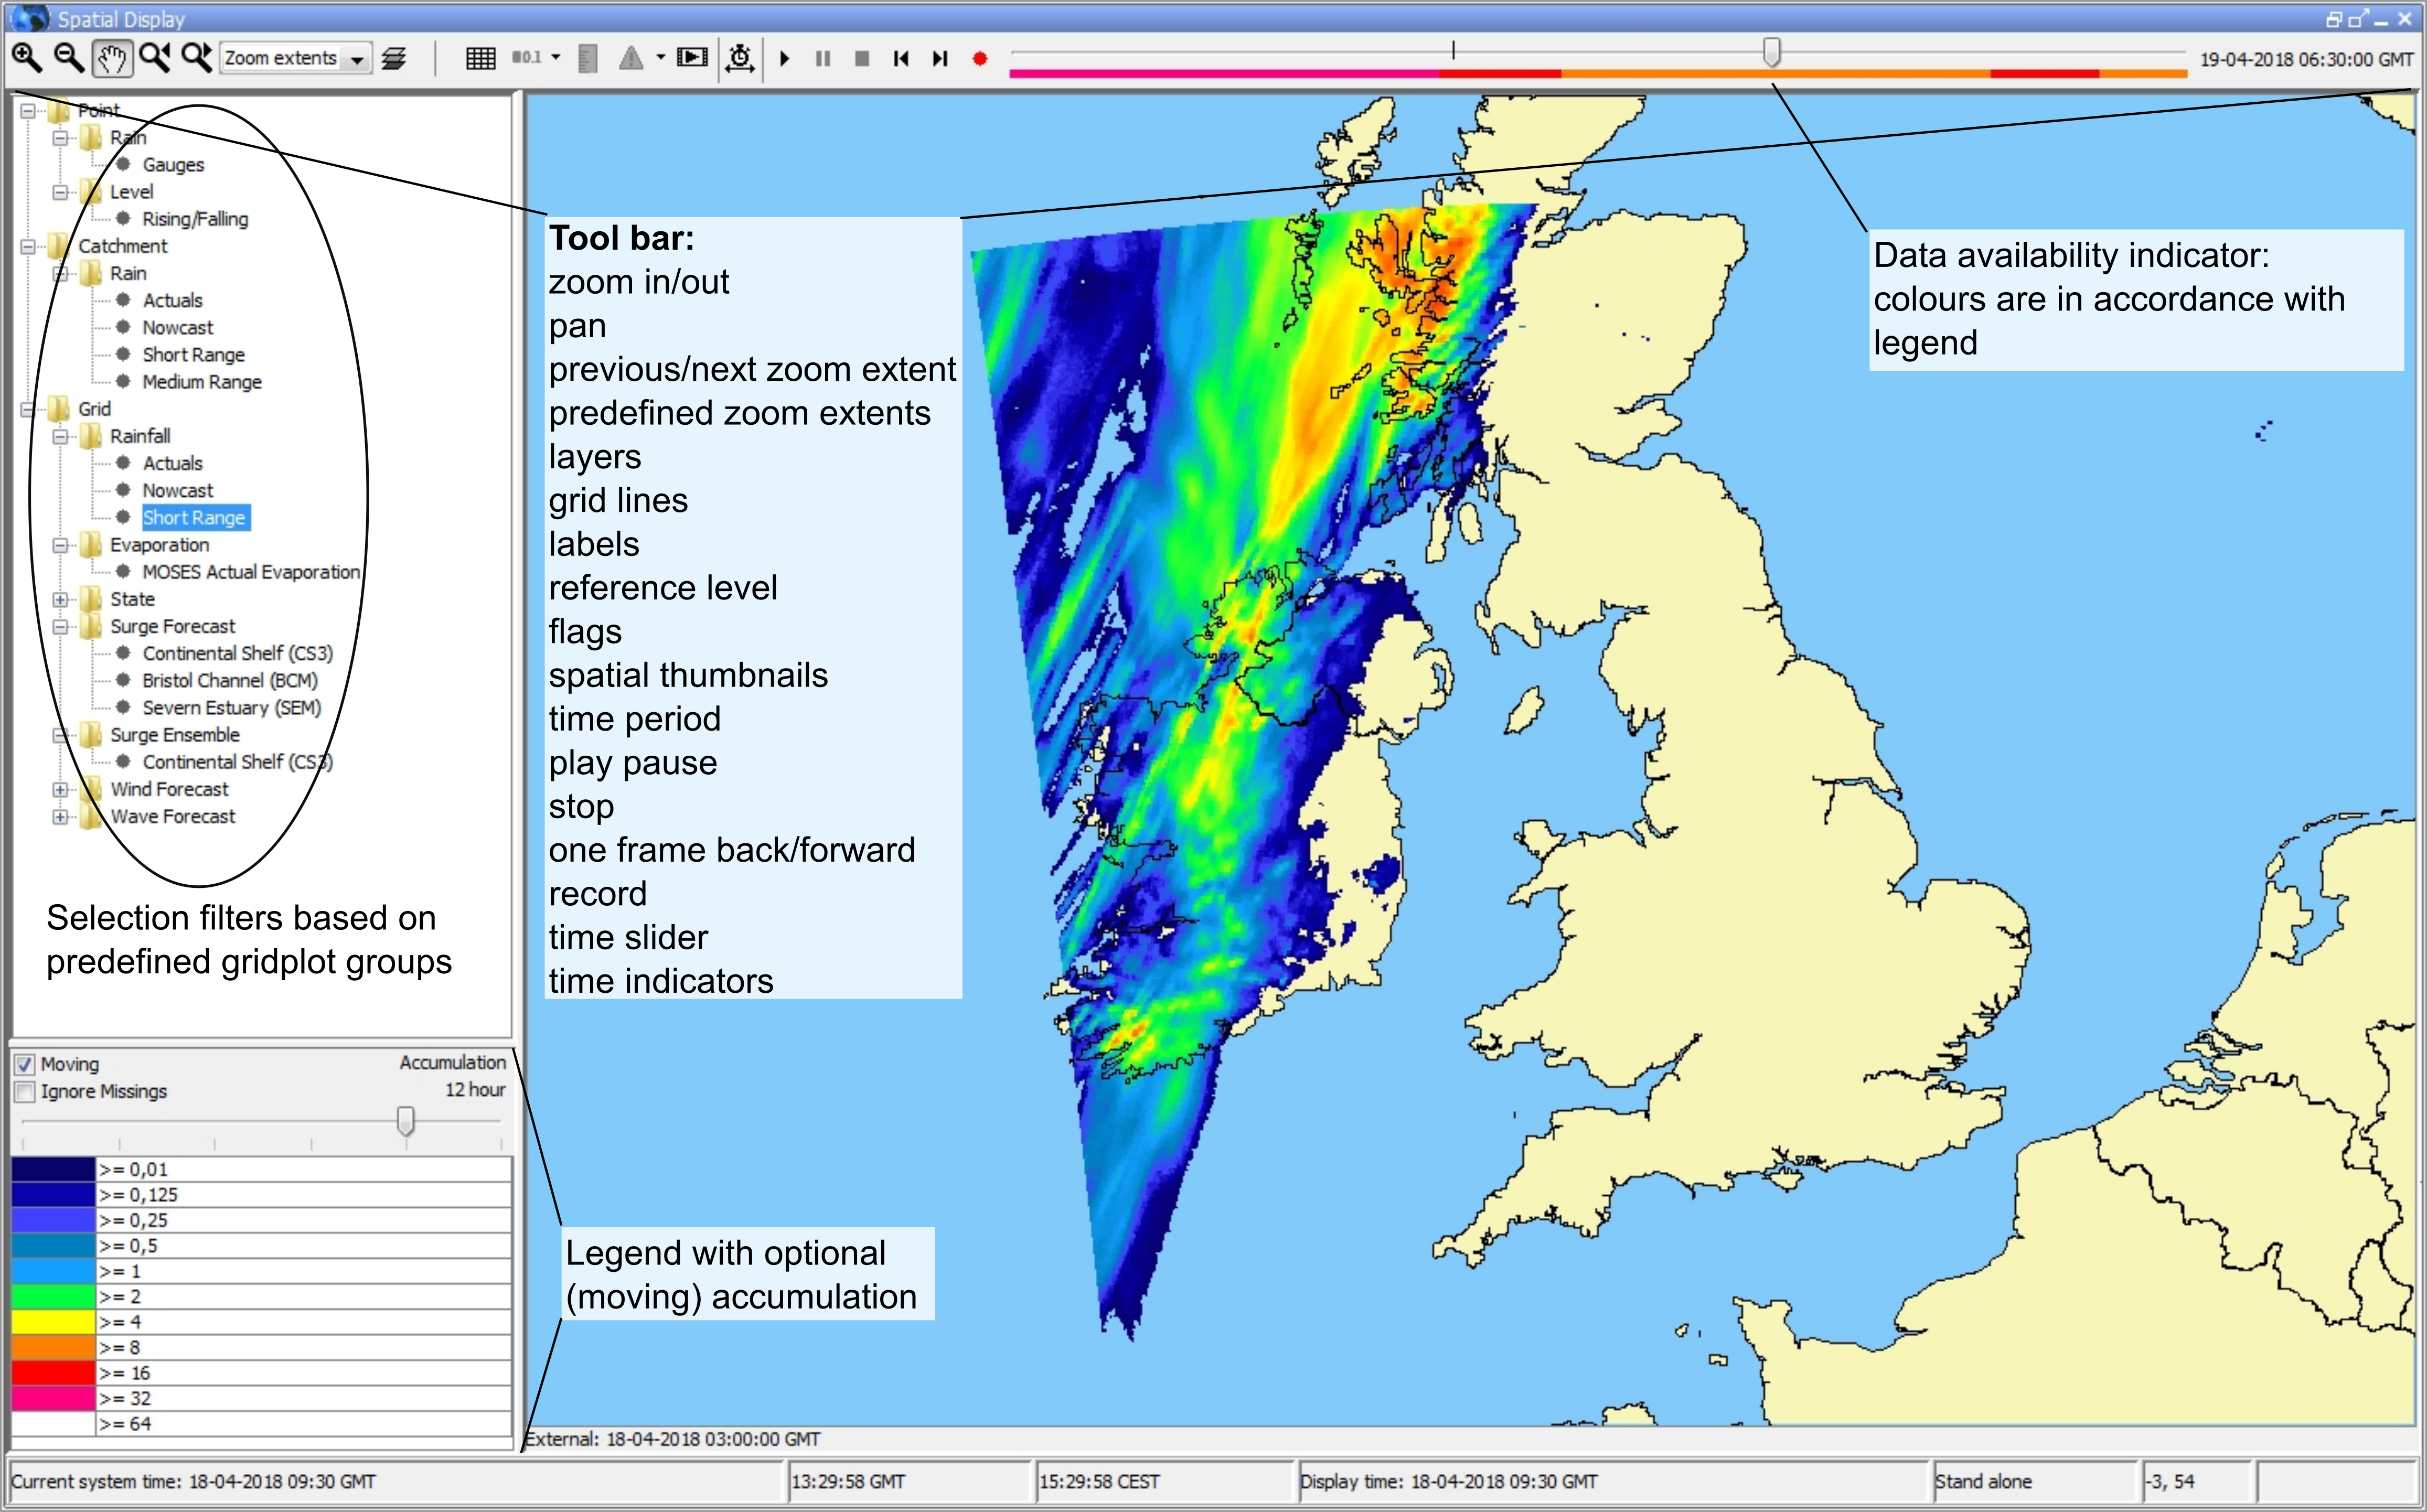
Spatial Display
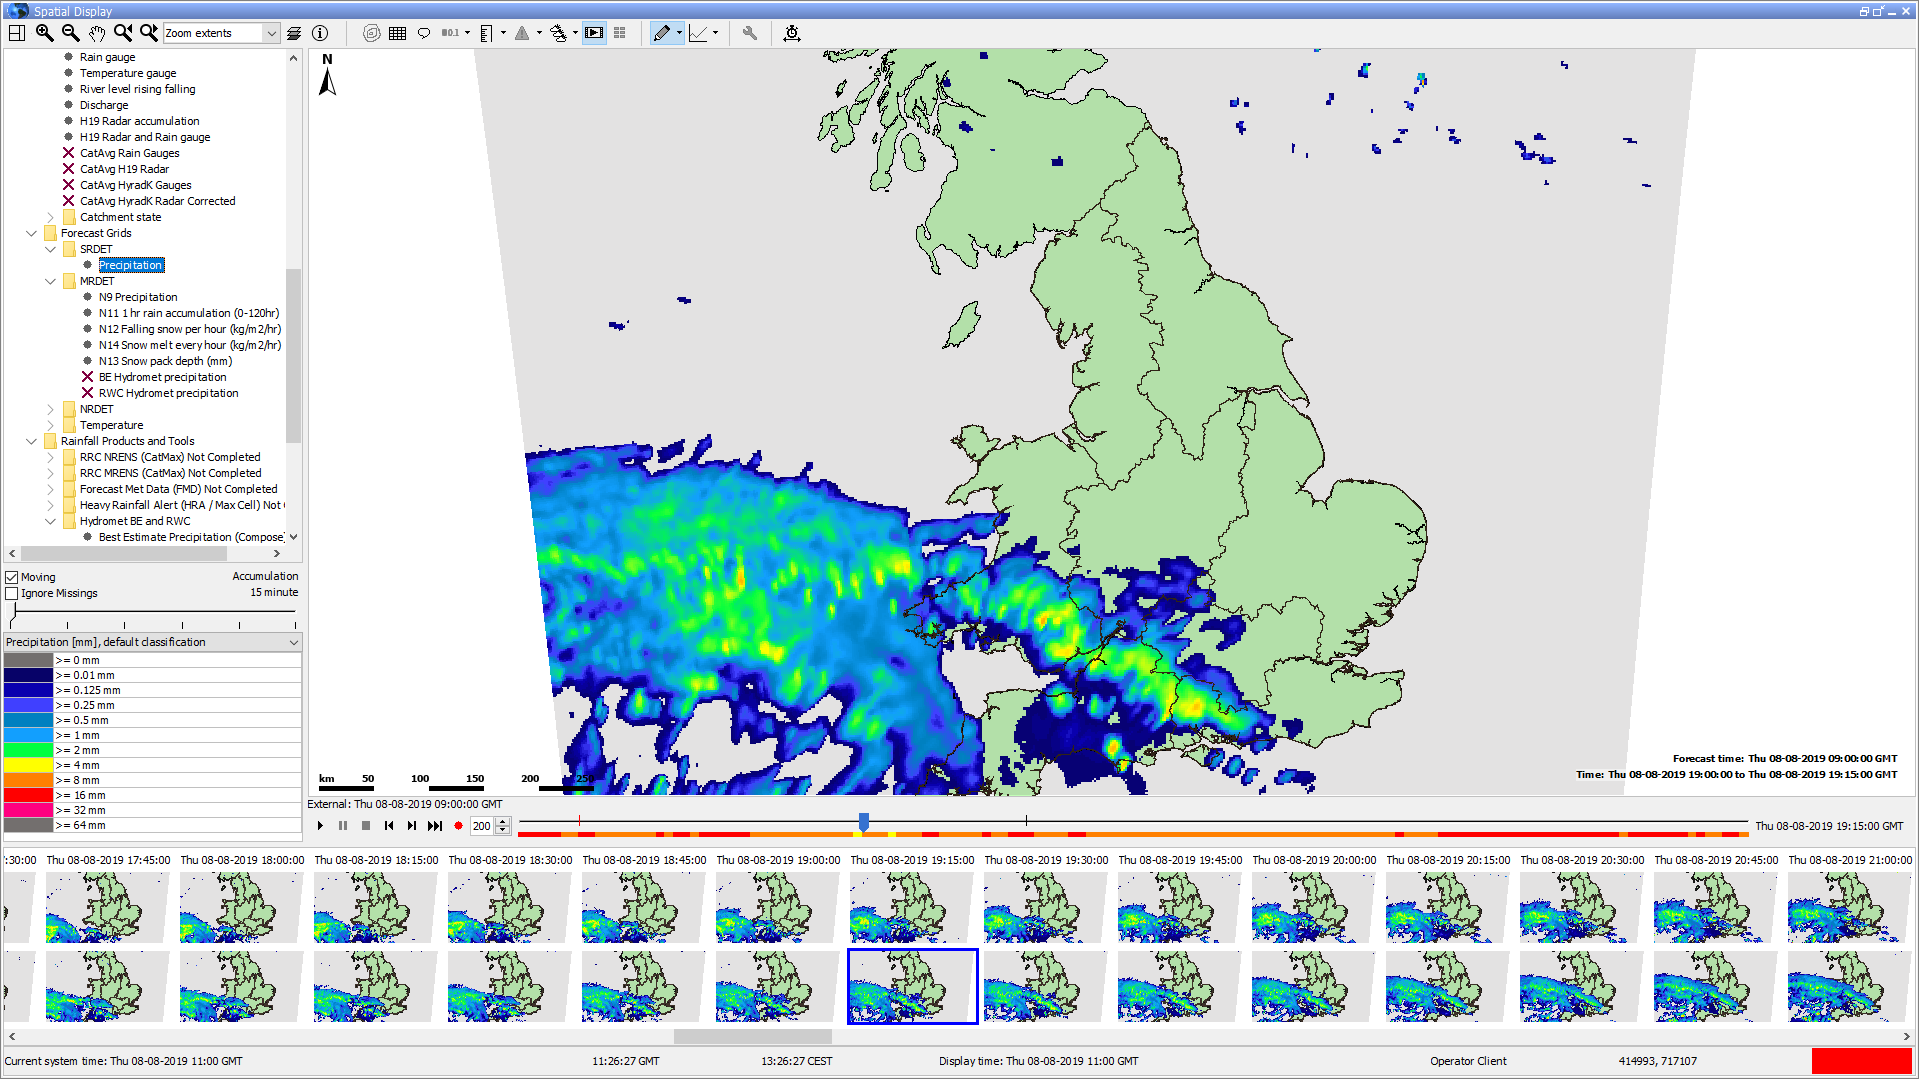
The Spatial Display grid display can be used to display show time series of any typekind: scalar, polygon, or grid (see the figures below for examples). The display will depict the data is shown on a map background. The time on the display time is then set using a ruler that can be moved manually by hand or made set to move automaticallyon its own.


The spatial display
...
is made up of the following
...
parts:
...
- A spatial, grid, or map display with
...
- layers that you can change
- A Control Toolbar with
...
- general options for:
- Zooming in and
...
- out and moving around
- Turning map layers or metadata on and off
...
- , like labels, values, flags, thresholds, etc.
- A Time Slider Toolbar with
...
- general options (
...
- found at the bottom of the map since 2019.02):
...
- Buttons for play, pause, stop, step forward, step backward, and record
...
...
- A time slider with a time slice indicator
...
- An indicator for data availability and maximum value
...
- (the colors match the legend)
- Filters for selecting what to show in the Spatial Display
...
- (you can set up plots ahead of time)
- A table or bar legend (you can choose to accumulate data)
- Options for exporting or recording
...
- data and time series

Control Toolbar
The toolbar provides the offers controls for displaying presenting the spatial information via through the following various buttons. The functionality of zoom options and layers is explained detailed in the FEWS Explorer section. (see see chapter 2).
Button | Description |
|---|---|
| Contours. |

| You can turn contour lines on |
| or off |
| . Numbers |
| show up when the animation |
| is stopped or paused. The colors, which |
| show the value |
| , stay visible. A bilinear interpolation is used to |
| make the grid smooth. This is |
| necessary for calculating the contours. |
| Even when the labels and |
| contour lines are |
| turned off, the smooth grid |
| can still |
| be seen. The bilinear interpolation is only |
| used on the cells of the grid that are rectangular and |
| aren’t rotated |
| too |
| much compared to the screen orientation. |

| Grid lines. Toggles grid or polygon lines on or off |
| Product Info. Toggles product info on or off. (only shown if there are products present in the configuration, see the page on the Forecast Product Information Panel) |
| Labels. |
| You can toggle labels on or off |
| . The drop-down options include turning |
| locations, values, and/or units in the labels on or off, and increasing |
| or decreasing the number of decimals shown in the labels and tooltips |
| . Since FEWS 2022.02, this also |
| works for grids, but only when |
| you zoom in |
| until there are |
| fewer than |
| 20,000 grid cells displayed and one of the cells is larger than 10 pixels. |

| Value to local reference level. |


| Flags. Switches to flags for selected time series / gridplot (quality, modifiers or thresholds) |
| Search and select forecasts. Switches to (previous) forecasts. |
| Show spatial thumbnails. Toggles thumbnails of each time step below the main spatial display on or off. |
| Show spatial ensemble thumbnails. Displays the ensemble thumbnails panel. |
| Sketch mode buttons and other sketch drawing options. Switches the sketch mode between drawing points, adding points, drawing longitudinal profiles and drawing areas when the map is clicked. Contains additional options to save/load sketches and delete the current sketch. |
| Options to show a graph based on current sketch. Drop-down menu with options to extract scalar time series, vertical profiles, longitudinal profiles, 2D longitudinal profiles, calculate budget and calculating the mean max min time series (for sketched areas). |
| Activate spatial modifier mode. Toggles spatial modifier mode on or off (only shown if at least one spatial modifier is configured in ModifierTypes.xml). The additional modifier mode buttons shown when modifier mode is toggled on are explained in the spatial modifier section. |

| Display time. Choose display time (period) |

| Attributes. |
Time Slider Toolbar
Since 2019.02 the The time slider and its buttons have been moved to a separate toolbar located at the bottom of the spatial display.
| Preload. Since the 2019.02 the grids are downloaded on the fly. With the The preload button allows the grids for all time steps are to be downloaded in the background to have a smooth animation without pauzes. A green line in the time slider shows the progress of the download. This ensures a smooth animation without pauses. The progress of the download is indicated by a green line on the time slider. | ||
| Play. Starts continuous play mode. The slider will indicate the time slice being shown. This button is merged with the pause button. So after this button is pressed, the pause button appears. | ||
| Pause. Stops continuous play mode. The time slider remains at the time displayed at the moment. This button appears if the play button is previously pressed and the continuous play mode is running. | ||
| One frame back. Moves the time slider back one timestep. | ||
| One frame forward. Moves the time slider forwards one timestep. | ||
| Record. Creates an This function creates a movie file in AVI or animated gif movie file. The avi GIF format. By default, the AVI format is used by default unless the filename ends with '‘.gif'gif’. After opening Once the file is opened, the display will start playing from the current time position , and will continue until the stop button is clicked. | ||
| Time sliderSlider | The time slider can be dragged to specific time slice. | ||
Data availability | The data availability indicator provides gives a visual clue as to where you can find data. For those times where hint about where data can be found. When data is available, the colour color of the data availability indicator will be set to match the maximum highest value found in the data for that time slice.
|


Selection filters
The selection filters show indicate which displays have been configured. Select set up. You can select a filter to display show the data. Note Keep in mind that each grid display may might be configured differently, i.e. with a different period of data to be displayed, with a different background map, etcset up differently, for example, they might show data from different periods, use different background maps, and so on. The configuration allows certain filters to be highlighted in in bold.


Locations attribute filter
With the location attribute filters, you can hide one or more locations/grids in the plot. The ![]() button (
button ( ![]() ) is only visilbe then attribtes visible when attributes are configured for the plot.
) is only visilbe then attribtes visible when attributes are configured for the plot.

Legend
The legend can be shown as table legend or as bar legend. The legend identifies the color used for each range of values. The range of values used for each color can be rescaled by right clicking on the display and selecting 'Rescale Classification' from the pop-up menu. The display colors will be updated to reflect the new classification. After rescaling, the lowest and highest values in the legend will correspond to the minimum and maximum values of the data in the current zoom extent of the display (for the selected time slice). When the display is zoomed in on an area where all data points or grid cells have similar colors, rescaling can be used to see more clearly the differences in the data values. To return to the default classification right click on the display and select 'Back To Default Classification' from the pop-up menu. When selecting a different plot, the classification always changes back to the default classification for that plot.
...