...
| Wiki Markup |
|---|
When the display is started through the FEWS Tools menu item _Data Editor_ , data can be edited and the edited data can be stored in the FEWS data base. When the display is started through the FEWS Tools menu item _Data Display_ or through the FEWS toolbar, the data can only be viewed. 1.1 <ac:structured-macro ac:name="anchor" ac:schema-version="1" ac:macro-id="f75c0d0ff8ba2dd8-e7418176-45904146-8c6fa81b-aae888a7c1bb494e0fa149e9"><ac:parameter ac:name="">_Toc172823841</ac:parameter></ac:structured-macro><ac:structured-macro ac:name="anchor" ac:schema-version="1" ac:macro-id="149a7f013607eb69-c1b2d483-4da74e68-b0af8c78-a3433b8f9767c7f401d48649"><ac:parameter ac:name="">_Toc140564169</ac:parameter></ac:structured-macro>Data Display Press the \[*Data Display* \] button !image002.png! on the toolbar to present graphs displaying the data. The splitter is normally positioned on the left of the display. |
...
Following buttons are used in the Time Series Display:
 Table
Table
By clicking this button the time series in the graph is also displayed in tabular format. Please note that in case you like to edit data, you have to select the Data Editor from the Tools menu (see section 4.3).
...
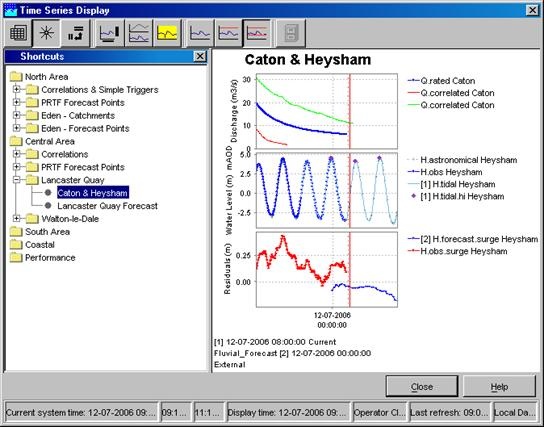
The data shown via the Shortcuts belong to the forecasts selected in the Forecasts panel of the FEWS Explorer. Please note that the current forecast is always displayed in the graphs.
 Rotate Splitter
With this button the splitter between table and graph can be placed in a horizontal position. Clicking the same button again returns the splitter to its default vertical position.
 Rotate Legend
This button can be used to place the graph legend underneath the graph. Clicking the same button again returns the legend to its default position at the right hand side of the graph.

 Toggle Graph
When multiple data series are selected for a single data type (parameter), the graphs will be placed in one subplot of the graph. This sometimes complicates the analysis of time series with different data ranges. By clicking the above mentioned button you can change the layout of the chart:
- Merged into a single graph
- Stacked in different subplots
 Scale to show unreliable Data
This button can be used to focus on time intervals with unreliable data within the selected time series. Data is marked as unreliable, if values exceed hard limits.
 Show no Thresholds
By clicking this button all pre-configured thresholds which can also be shown in the graphs with the selected time series disappear.
 Scale to show relevant Thresholds
With this option the graph is scaled in such a way, that relevant thresholds (the closest threshold values) are displayed together with the selected time series in the graph.

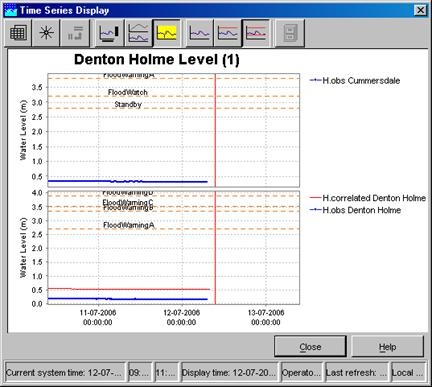
 Scale to show all Thresholds
This button can be used to show all pre-configured thresholds of a certain parameter at the selected location(s). This means that all thresholds levels (e.g. Standby, Flood Watch, Flood Warning and Severe Flood Warning) are displayed in the graph.

...
Show data labels
...
Clicking the 'Show data labels' will you to display quality flags for the data you are presenting. The information is shown at the bottom of the screen.
The following clolour codes have been used:
...
The lines are displayed under the data points. The colours correspond with the colouring used in the tables.

Wiki Markup
 Historical Events
With this button historical events can be activated (provided that they are !image028.png! Historical Events With this button historical events can be activated (provided that they are pre-configured). They will be displayed in the same graph to enable a comparison with the actual timeseries. Further explanation is given in section 4.4.
Display time
| Wiki Markup |
|---|
time To change the view period in the graph, the field _Display time_ in the Status Bar below the graph should be double clicked. The display time can now be changed with help of the menu. Press \[*OK* \] to accept the changed view period. The next time the chart is opened the original configured display time will be used again. !image030.png! Datum Toggle The Datum Toggle at the lower right hand corner of the display allows levels to be displayed with reference to _Local Datum_ or _mAOD_ . !image032.png! 1.2 <ac:structured-macro ac:name="anchor" ac:schema-version="1" ac:macro-id="05bca230-a23c-460c-8085-9cb2fdc57110"><ac:parameter ac:name="">_Toc172823842</ac:parameter></ac:structured-macro>Navigating in Graphs Zooming in and out can be done with help of the scroll wheel of the mouse. Scrolling away from the user results in zooming in while scrolling towards the user results in zooming |

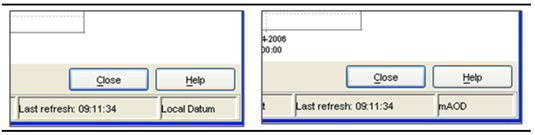
Datum Toggle
The Datum Toggle at the lower right hand corner of the display allows levels to be displayed with reference to Local Datum or mAOD .
Navigating in Graphs
Zooming in and out can be done with help of the scroll wheel of the mouse. Scrolling away from the user results in zooming in while scrolling towards the user results in zooming out.
Zooming is also possible by selecting a zoom range. Drag the mouse holding down the right button to form a rectangular area to zoom in to.
When clicking the right mouse button, the dropdown menu presented below appears. The menu gives you some additional options.
 1.3 1.4 h5.
Save As
You can save the graph to file with this option.
1.5 1.6 h5.
This option allows you to print the graph.
1.7 1.8 h5.
Zoom in & out
You can select to zoom in and out along one or both axis with this option.
1.9 1.10 h5.
Allow Domain / Range Axis Zoom
You can select to allow for zooming in and out along one of the axis with this option.
1.11 1.12 h5.
Auto Range
This feature allows you the set automatic scaling along one or both axis.1.13 Anchor
Data Editor
Select the Data Editor option of the FEWS Tools menu to present tables displaying the data. The splitter can be positioned in such a way, that the complete table is visible.
...
| Wiki Markup |
|---|
Through manual editing of data, the source of the data changes from original to corrected. The font colour used for edited data is blue to indicate that it is completed data. The background colour remains white, as the data has not yet been validated. If however, after pressing \[*Apply* \] validation indicates that the value exceeds certain validation limits, the background colour will be set accordingly.
1.14 \\
1.15 h5. Editing Data
By pressing the right mouse button a list with edit actions appears on the screen. These includes to copy and fill in data. The display that pops up after clicking the right mouse button is shown |
Editing Data
By pressing the right mouse button a list with edit actions appears on the screen. These includes to copy and fill in data. The display that pops up after clicking the right mouse button is shown below.

The options have the following meaning...
<ac:structured-macro ac:name="unmigrated-wiki-markup" ac:schema-version="1" ac:macro-id="d2a3c40b103c8318-e789f106-4a3a4d60-bf7da27a-aa1a44b2f77c96c0b743c319"><ac:plain-text-body><![CDATA[ | [Select All] | Select all data displayed in the editor | ]]></ac:plain-text-body></ac:structured-macro> |
<ac:structured-macro ac:name="unmigrated-wiki-markup" ac:schema-version="1" ac:macro-id="191b642f4c9aa1ec-395e9d77-415b49c5-a5aa9ce7-120381b2d5081f4090d840a8"><ac:plain-text-body><![CDATA[ | [Select Column] | Select all data in the column in which the cursor is placed | ]]></ac:plain-text-body></ac:structured-macro> |
<ac:structured-macro ac:name="unmigrated-wiki-markup" ac:schema-version="1" ac:macro-id="6cbf02cedd5df5aa-aed567f0-492c4009-9bc29fb3-5855c96c71f75348d2c792f2"><ac:plain-text-body><![CDATA[ | [Select Row] | Select all data in the row in which the cursor is placed | ]]></ac:plain-text-body></ac:structured-macro> |
<ac:structured-macro ac:name="unmigrated-wiki-markup" ac:schema-version="1" ac:macro-id="c3f62dc3c978ad92-4488646a-466d4b77-840489ce-d809b64db237ad0c7dd5c4ce"><ac:plain-text-body><![CDATA[ | [Expand Selection] | Select all data in the row in which the cursor is placed | ]]></ac:plain-text-body></ac:structured-macro> |
<ac:structured-macro ac:name="unmigrated-wiki-markup" ac:schema-version="1" ac:macro-id="466e6c6faefb34f5-70d2e8e9-4ef840a1-a70eb07b-6536ffc11144f312ce59d67a"><ac:plain-text-body><![CDATA[ | [Edit Value] | The cell on which the cursor is place can be edited | ]]></ac:plain-text-body></ac:structured-macro> |
<ac:structured-macro ac:name="unmigrated-wiki-markup" ac:schema-version="1" ac:macro-id="ff48c7b5c14289c4-a81fcb51-4a9b40d9-a0fe8bc2-13a401a1951a37447fcbc5c1"><ac:plain-text-body><![CDATA[ | [Cut] | Move the selected data (including the date / time field) to the clipboard | ]]></ac:plain-text-body></ac:structured-macro> |
<ac:structured-macro ac:name="unmigrated-wiki-markup" ac:schema-version="1" ac:macro-id="f0634992e495863a-5dfbb5bf-4543483b-83f7a5ad-74a3feddc36044264569cc72"><ac:plain-text-body><![CDATA[ | [Copy] | Copy the selected data (included the date / time field) to the clipboard | ]]></ac:plain-text-body></ac:structured-macro> |
<ac:structured-macro ac:name="unmigrated-wiki-markup" ac:schema-version="1" ac:macro-id="aa9f4bd3d10c4bf8-81f59612-42d04885-9effafd4-6c37e2a7f3b4d7cb6cf812b4"><ac:plain-text-body><![CDATA[ | [Copy Values Only] | Copy the data values in the selection to the clipboard | ]]></ac:plain-text-body></ac:structured-macro> |
<ac:structured-macro ac:name="unmigrated-wiki-markup" ac:schema-version="1" ac:macro-id="dd05578db9a28bed-4bdf2945-446843b4-b03798be-d14b19e0605536054c32c71b"><ac:plain-text-body><![CDATA[ | [Copy Reliable Values Only] | Copy the data values in the selection classified as reliable to the clipboard | ]]></ac:plain-text-body></ac:structured-macro> |
<ac:structured-macro ac:name="unmigrated-wiki-markup" ac:schema-version="1" ac:macro-id="31d69560c78b81fd-2376d93a-459749d6-abe9bbaf-3206657e250fc6b2137c0a82"><ac:plain-text-body><![CDATA[ | [Copy Reliable and Doubtful Values Only] | Copy the data values in the selection classified as reliable and doubtful to the clipboard | ]]></ac:plain-text-body></ac:structured-macro> |
<ac:structured-macro ac:name="unmigrated-wiki-markup" ac:schema-version="1" ac:macro-id="8e6faac7b65d0a31-f156fd38-441b48cd-b3c7996f-06287b74fff97d15e7b4e844"><ac:plain-text-body><![CDATA[ | [Copy Times Only] | Copy the selected date / time in the selection to clipboard | ]]></ac:plain-text-body></ac:structured-macro> |
<ac:structured-macro ac:name="unmigrated-wiki-markup" ac:schema-version="1" ac:macro-id="992bdd6f1a5f42b7-30edcdd7-4c53453f-beac8095-425ca476204e7042384b6dfd"><ac:plain-text-body><![CDATA[ | [Paste] | Paste the data from the clipboard into the selected fields | ]]></ac:plain-text-body></ac:structured-macro> |
<ac:structured-macro ac:name="unmigrated-wiki-markup" ac:schema-version="1" ac:macro-id="89db81b7942a040d-a3e6dadf-4d76477a-82b9bb20-7a529bb3eed6ab60232e896b"><ac:plain-text-body><![CDATA[ | [Clear] | Delete the data values in the selection | ]]></ac:plain-text-body></ac:structured-macro> |
<ac:structured-macro ac:name="unmigrated-wiki-markup" ac:schema-version="1" ac:macro-id="568e8073903d0810-f69f2bb4-429140a8-8c039357-f762e6910049fed0837b6aaf"><ac:plain-text-body><![CDATA[ | [Clear Doubtfuls] | Delete the data values in the selection classified as doubtful | ]]></ac:plain-text-body></ac:structured-macro> |
<ac:structured-macro ac:name="unmigrated-wiki-markup" ac:schema-version="1" ac:macro-id="b76a9cd74bb7fbe0-1cd7b7c7-4f974299-bfea9262-bc2c28c4c9e11f34f242ab1d"><ac:plain-text-body><![CDATA[ | [Clear Unreliables] | Delete the data values in the selection classified as unreliable | ]]></ac:plain-text-body></ac:structured-macro> |
<ac:structured-macro ac:name="unmigrated-wiki-markup" ac:schema-version="1" ac:macro-id="ec2d976bbb8f3be2-59981be8-4e584674-b0b38916-51f31ae1a99b5441ca03dab5"><ac:plain-text-body><![CDATA[ | [Block Fill Missing Data] | Fill the selected fields with the last value available value in the same column | ]]></ac:plain-text-body></ac:structured-macro> |
<ac:structured-macro ac:name="unmigrated-wiki-markup" ac:schema-version="1" ac:macro-id="2be5d3dd2832a6fe-5f928d11-4fd8471b-b22fa02a-14d17596f3e3ec185b56bfc9"><ac:plain-text-body><![CDATA[ | [Lineair Fill Missing Data] | Apply lineair interpolation when filling in the selected fields | ]]></ac:plain-text-body></ac:structured-macro> |
<ac:structured-macro ac:name="unmigrated-wiki-markup" ac:schema-version="1" ac:macro-id="89558887ec08e041-617db2db-42094b2e-9f4faedb-9b901fed4ad41175ec66aef7"><ac:plain-text-body><![CDATA[ | [Fill Missing Data from Clipboard] | Fill in the selected fields with data copied to the clipboard | ]]></ac:plain-text-body></ac:structured-macro> |
1.16 *
...
...
Historic Events
A special option in the Data Display is the option to add historic events to the chart window.
To show historic events for a specific location take following steps:
...
| Wiki Markup |
|---|
A small pop-up window shows that you can now shift the historic event forwards and backwards by pressing the "+" or "-" keys on your keyboard. When the shift procedure is completed press \[*Done* \]. 1.18 |