Spatial Display
The Spatial Display grid display can be used to display time series of any type: scalar, polygon or grid. The display will depict the data on a map background. The display time is then set using a ruler that can be moved manually or made to move automatically.
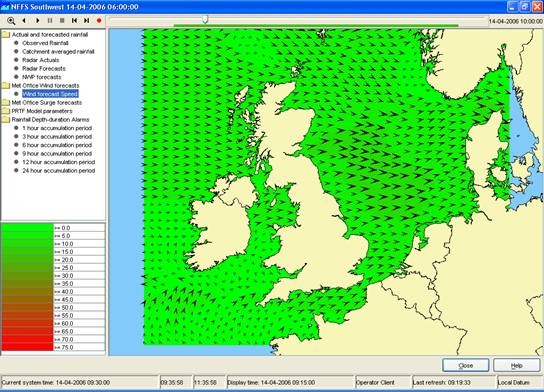
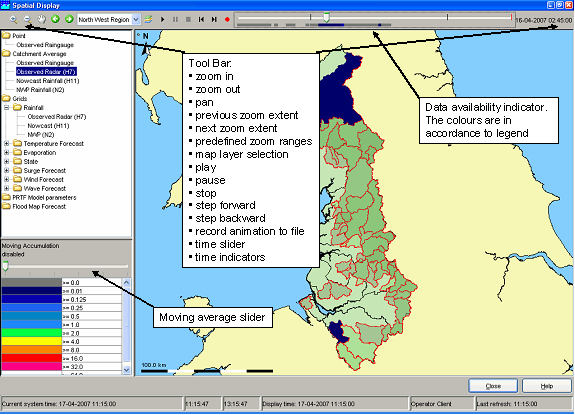
The spatial display consists of following components:
- Spatial Display selection filters
- Control Toolbar with following options:
- Manual zoom and zoom previous buttons
- Predefined zoom range selector
- Play, pause, stop, step forward, step backward and record buttons
- Time slider with time slice indicator
- Data availability and maximum value indicator
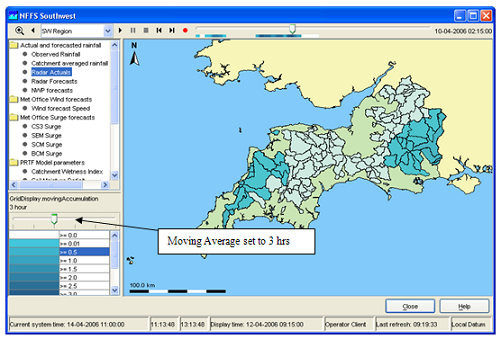
- Moving average slider
- Legend
- Contours button
- Export time step data in ascii grid-file
Grid display selection filters
The selection filters show which displays have been configured. Select a filter to display the data. Note that each grid display may be configured differently, i.e. with a different period of data to be displayed, with a different background map, etc. The configuration allows filters to be highlighted in bold.
Control Toolbar
The toolbar provides the controls for displaying the spatial information via through the following buttons:
Legend
The legend identifies the colour used for each range of values.
...