...
The content of the forecast help dialog is depended of which node is selected in the forecaster panel.
When a new node is selected the content of the forecaster help dialog is automatically updated.
Run info
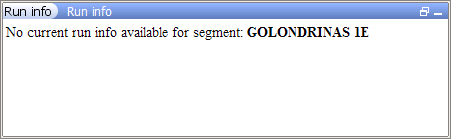
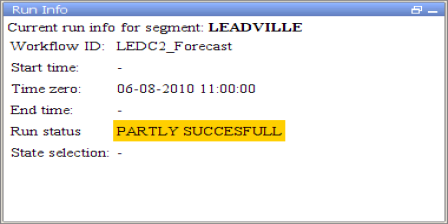
The run info panel shows detail information of the latest run of the workflow of the selected node.
If the workflow of the node has not run yet for the current T0 then the panel will show that there is no current run info available
...
When the run is partly successful the icon of that node will be set to the red exclamation mark, the run status box in the run info panel will be set to yellow. When the run is failed the icon of the node will be set to the red exclamation mark, the run status box will be set to red.
Forecaster notes
The forecaster notes panel shows the notes other forecaster have created regarding their previous forecasts for the forecast point. Forecasters can also created their own note and publish them.

How to create a forecast with the IFD
Steps in creating a forecast
Below is a list of all possible steps in creating a forecast with the IFD. Please note that not all of the listed steps are obligated. For each step will be explained how this step can be carried out using the IFD in FEWS.
...
When the forecaster thinks that the current forecast is sufficient. The forecast can select the parent node of the leaf nodes and press the 'run on server'-button. When this button is pressed, first all the new modifiers and changes to the existing modifiers of the child nodes of the selected node will be uploaded to the server. When the upload is successful the workflow will be run at the server. The locally created runs will be deleted when the server run was successful and the results are downloaded successfully back to the Operator Client.
Dockable windows
...
Docking and undocking main displays
All windows in the centre section of FEWS can be undocked. This can easily be done by clicking on the square-box icon beside the x-icon at the tab of each display. Undocking the windows allows the forecaster to arrange the windows as they like.
After clicking on the icon the display will automatically be undocked. Putting the display back in docking mode can be done by clicking on the double square icon at the top of the display. By clicking on the x-icon the display can be closed. 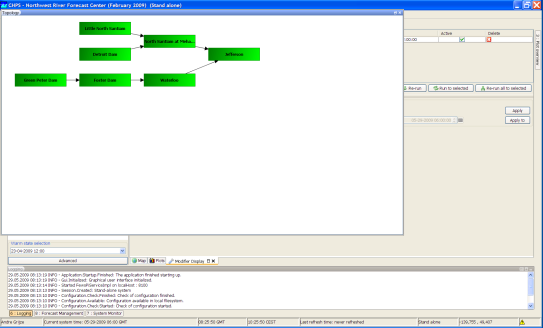
...
...
Save display layout and reload on opening with same user
By default FEWS will start with the map display opened in the centre section of the display and with the map display, data display and the topology display docked in the centre section of FEWS. It is possible to customize the display layout. First step in customizing the display layout is to manually place the display in the desired display layout. In the example below three displays are undocked and the graph-tab and the display are moved to the left section of the display. In the File-menu the user can store this layout by selecting the option store layout. The next time FEWS is started it will start with the stored layout.
...
...
Save display layout and reload default layout
The file-menu also provides an option default layout. By selecting this option the default layout can be reloaded.
...
ModifierTypes.xml
In the modifierTypes.xml we can define which kind of modifiers can be used in the interactive forecasting process. More information about this topic can be found in the chapter Modifiers.