| scrollbar |
|---|
| Table of Contents |
|---|
General Status
On the top right corner of the status page the last refresh time of is displayed. A refresh can be triggered manually by clicking the refresh button or can be done automatically by checking the auto refresh box next to the refresh button.
![]()
At the top of the dashboard page the general status of the live system components is visible:
- Master Controller
- Number of pending and running tasks
- Number of active users (Operator Client users and Config Manager users)
- Remote Master Controllers (only available in a multi MC system)

Master Controller Status

General status indication of the master controller. Possible states:
- OK: master controller is working as expected. Component will displayed green.
- Unknown: The status of the master controller is unknown. The component will be displayed in gray.
- Failed: The master controller is in failed state. The component will be displayed in red.
In case detailed information is required, a link to the details is available at the bottom of this component.
Running and Pending tasks Status

Indicates the number of currently running and pending tasks. In case detailed information is required, a link to the details page is available at the bottom of this component.
Active Users Status

Indicates the number of currently connected clients. This includes the number of Operator Clients and Config Manager clients. For a multi MC system the connections over all MC's is displayed. In case detailed information per MC is required, a link to the details page is available at the bottom of this component.
Remote Master Controllers Status

In case of a multi MC system, one or more components will be displayed for each configured Remote Master Controller. The status indications are the same as for the Master Controller status.
Master Controllers Components Status

The different master controller components are:
...
The MC Rolling Barrel has a tooltip when hovering over the  . This will display statistics about the rolling barrel.

Forecasting Shell Servers Status
The FSS status table displays all Forecasting Shells that are active. A FSS is active when a heartbeat was received in the last 5 minutes.
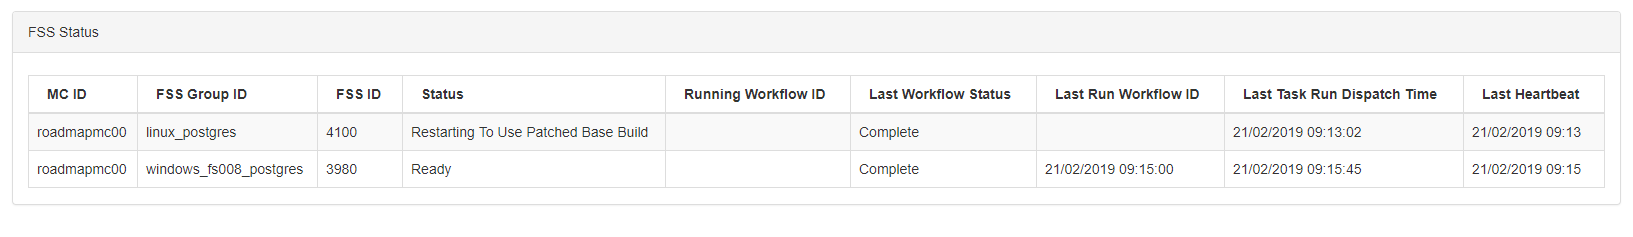
The different columns are explained in the following table:
...
Last Workflow Dispatch Time
...
Since 2019.02 the FSS status page will display all forecasting shells that are down. If one or more Forecasting Shell Servers are down, the general FSS Status will be displayed as "failed" and a warning color will be displayed. In the following example there are 2 FSSs with a status "No Heartbeat".

It is possible to acknowledge the failed state of the Forecasting Shell on the Forecasting Shell Servers page. On the page one or more FSSs in a failed state can be selected and acknowledged. After acknowledging the failed state the FSS Status will be displayed as follows:

FSS Details
Each row in the FSS status table is clickable to display some details about a Forecasting Shell.

The following FSS details are displayed
| element | description |
|---|---|
| FSS ID | The Forecasting Shell Server FSS id. |
| FSS Status | FSS status. Code and description of the FSS status |
| FSS Hostname | Hostname the FSS is running on |
| Allocated Memory | The amount of RAM memory in MByte that is available to the FSS |
| Number of CPUs | WorkflowId run on the listed Forecasting Shell Server. |
Host Slot Count | Number of slots available on the FSS server (usually the number of CPUs) |
| Index at Host | The index of the slot that is used by the FSS. |
| Children Display |
|---|