...
Button | Description |
|---|---|
 | Contours. To turn on/off contour lines (regular grids configured with contour lines only). Numbers appear when the animation has stopped or paused. The colors, which indicate the value remain visible. |
 | Grid lines. Toggles grid or polygon lines on or off |
| Product Info. Toggles product info on or off. (only shown if there are products present in the configuration, see the page on the Forecast Product Information Panel) |
| Labels. Toggles labels on or off (drop down options include turning on/off locations, values and/or units in the labels and increasing /decreasing the number of decimals shown in the labels and tooltips) |
 | Value to local reference level. |

| Flags. Switches to flags for selected time series / gridplot (quality, modifiers or thresholds) |
| Search and select forecasts. Switches to (previous) forecasts. |
| Show spatial thumbnails. Toggles thumbnails of each time step below the main spatial display on or off. |
| Show spatial ensemble thumbnails. Displays the ensemble thumbnails panel. |
| Sketch mode buttons and other sketch drawing options. Switches the sketch mode between drawing points, adding points, drawing longitudinal profiles and drawing areas when the map is clicked. Contains additional options to save/load sketches and delete the current sketch. |
| Options to show a graph based on current sketch. Drop-down menu with options to extract scalar time series, vertical profiles, longitudinal profiles, 2D longitudinal profiles, calculate budget and calculating the mean max min time series (for sketched areas). |
| Activate spatial modifier mode. Toggles spatial modifier mode on or off (only shown if at least one spatial modifier is configured in ModifierTypes.xml). The additional modifier mode buttons shown when modifier mode is toggled on are explained in the spatial modifier section. |
| Display time. Choose display time (period) |
 | Attributes. |


...
Extracting data from the Spatial Display
| Info | ||
|---|---|---|
| ||
In 2019.02 the options to extract data from the spatial display where moved from the right-click menu of the map to the drop-down menu of a new |
Export time step data in ascii grid-file
...
Scalar time series can be extracted from the grid by double clicking the point of interest. Depending on the type of data, which is displayed, the scalar time series will be relevant to either a point, polygon or grid cell. This can also be done in the following way. First select the point of interest by left clicking. A colored dot will be drawn to indicate the selected point. For grid data an additional green dot will be drawn to indicate the center of the selected grid cell (you may need to zoom in to see the green dot since it will be covered by the colored dot if they overlap). Extract the time series for the selected point either by selecting 'Show Time Series' from the drop-down menu of the ![]()
![]() button or by using the Ctrl+F3 shortcut.
button or by using the Ctrl+F3 shortcut.
...
Several points can be drawing by selecting the "Draw PointsAdd Point" sketch mode mode ![]() through the sketch mode button or holding the left ctrl and shift buttons while left clicking on the points of interest. When several points have been drawn, the "Show time Series" and "Copy Time Series" options will show/copy separate time series for each of the drawn points.
through the sketch mode button or holding the left ctrl and shift buttons while left clicking on the points of interest. When several points have been drawn, the "Show time Series" and "Copy Time Series" options will show/copy separate time series for each of the drawn points.
Instead of manually drawing a point / points, the 'Show Time Series For Coordinates...' option in the drop-down menu of the ![]()
![]() button can be used (shortcut: Ctrl+Shift+F3) which will open a small dialog prompting the user to enter coordinates of the point they wish to use.
button can be used (shortcut: Ctrl+Shift+F3) which will open a small dialog prompting the user to enter coordinates of the point they wish to use.
...
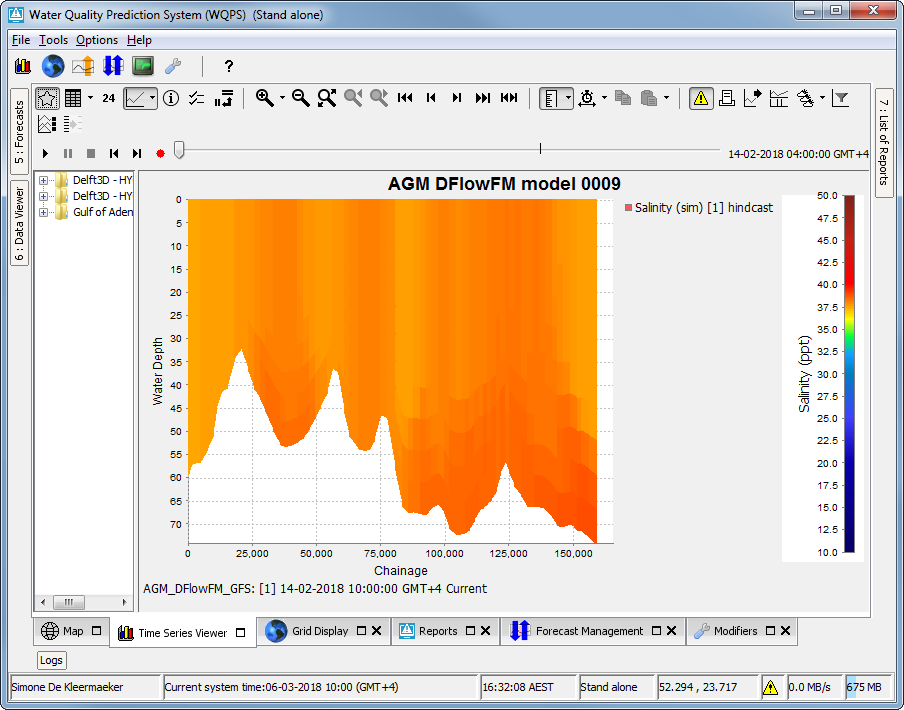
When the spatial display is showing 3D (layered) data, a vertical profile can be extracted. A point should be drawn as described in the previous section, then select the 'Show Vertical Profile' option by right clicking or in the drop-down menu of the ![]() button or press Ctrl+F4 to show a time series dialog with the vertical profile for the drawn point. Alternatively a 'Show Vertical Profile For Coordinates...' option is available by right clicking in the drop-down menu or by pressing Ctrl+F5Shift+F4. The vertical profile will be shown as a line graph of the parameter versus the water depth. One can also create a vertcial vertical profile with a color map by selecting the 'Use Color Map' option in the drop-down menu of the
button or press Ctrl+F4 to show a time series dialog with the vertical profile for the drawn point. Alternatively a 'Show Vertical Profile For Coordinates...' option is available by right clicking in the drop-down menu or by pressing Ctrl+F5Shift+F4. The vertical profile will be shown as a line graph of the parameter versus the water depth. One can also create a vertcial vertical profile with a color map by selecting the 'Use Color Map' option in the drop-down menu of the ![]() button or using Ctrl-M. The vertical profile will then be shown as a graph of water depth over time with the colors in the plot indicating the values of the selected parameter.
button or using Ctrl-M. The vertical profile will then be shown as a graph of water depth over time with the colors in the plot indicating the values of the selected parameter.
...
Longitudinal profiles time series can be extracted from grid data and shown in a separate graph as well. The profile (or cross section) is defined by drawing a profile sketch. Start drawing a profile sketch either by opening the drop-down menu of the sketch mode button and selecting 'Start Drawing Draw Longitudinal Profile' or by Ctrl+left clicking on the desired start point for the profile. A colored dot will be drawn to indicate the selected start point. Add additional line segments to the profile by left clicking in the display. Finish drawing by double-clicking on the desired end point for the profile. Green dots along the profile indicate which grid cells are used for the profile.
Once a profile sketch has been drawn, extract the profile either by selecting 'Show Longitudinal Profile' from the drop-down menu option by right clicking or by of the ![]() button or by using the Ctrl+F2 shortcut. The graph of the profile will show automatically.
button or by using the Ctrl+F2 shortcut. The graph of the profile will show automatically.
...
Create a 2D longitudinal profile for 3D data a in the spatial display. A longitudinal profile should be drawn as described in the previous section. Open up the 2D longitudinal profile in the Time Series Display with Ctrl-F11, or by selecting the 'Show 2D Longitudinal Profile' option in the drop-down menu by right-clickingof the ![]() button. There is also a 'Show 2D Longitudinal Profile For Coordinates...' option, to allow entering coordinates of the profile points instead of sketching the profile on the map.
button. There is also a 'Show 2D Longitudinal Profile For Coordinates...' option, to allow entering coordinates of the profile points instead of sketching the profile on the map.
Note, this feature only works for
- data within 1 grid partition. In some cases 3D data model runs are run on multiple domain partitions. This data can be shown as a 2D longitudinal profile, but only if the profile remains within a single domain.
- scalar data (e.g. Water temperature or salinity), and not yet for vector data like currents.
...

Extracting data for an area from a grid time series (Calculate Budget)
...
The specific part of the grid is defined by drawing an area sketch (a closed polygon surrounding the desired area). Start drawing an area sketch either by selecting 'Start Drawing Draw Area' from the drop-down menu of the sketch mode button and then left clicking the map, or by Shift+left clicking on the desired start point for the area. A colored dot will be drawn to indicate the selected point. Add additional line segments along the edge of the desired area by left clicking in the display. Finish drawing by double-clicking. The last point in the sketch will be connected to the first point automatically to create a closed polygon that surrounds the desired area.
Once an area sketch has been drawn, extract the desired data by selecting the 'Calculate Budget' option from the drop-down menu of the "use sketch button" ![]() button. The corresponding graph will show automatically. The 'Calculate Budget' option will perform one of the following calculations, depending on the type and the dimension of the selected data.
button. The corresponding graph will show automatically. The 'Calculate Budget' option will perform one of the following calculations, depending on the type and the dimension of the selected data.
...
Available since 2019.02. An area should be drawn as described in the first paragraph of the previous section. Then select 'Show Min Max Mean Time Series For Area' in the drop-down menu of the ![]()
![]() button. A Time Series Dialog will show the expected time series.
button. A Time Series Dialog will show the expected time series.
...
When spatial modifier mode is activated, the spatial modifier button section will appear in the toolbar. This contains the following buttons.
Button | Description |
|---|---|
| Start time. Select the current time as new modifier start time. |
| End time. Select the current time as new modifier end time. |
| Clear period. Clear the selected new modifier period. |
| Copy modifier. Used when creating spatial copy modifiers. |
| Paste modifier. Used when creating spatial copy modifiers. |
| Spatial profile. Used to create a spatial profile modifier. |
...
To select the new modifier period, first select the time step you wish to use as the start or end time. Then the ![]()
![]() and
and ![]()
![]() buttons can be used to select the current time step as the new modifier period start or end time respectively. Alternatively, the time slider has been given a right-click menu which also contains these options:
buttons can be used to select the current time step as the new modifier period start or end time respectively. Alternatively, the time slider has been given a right-click menu which also contains these options:
...
The selected new modifier period can be cleared through the ![]()
![]() button or the "Clear the selected new modifier period" option in the right-click menu of the time slider.
button or the "Clear the selected new modifier period" option in the right-click menu of the time slider.
...