Introduction
The Workflow Navigator (WN) is a helpful tool for understanding the hierarchical structure of your workflows and all underlying modules, module - instances, and incoming/outgoing timeseriestime series. It can also highlight the usage of specific timeseries time series throughout your config so that you can 'trace' configuration, allowing you to trace where data is produced and (re)used. The WN displays workflows in a clickable tree - structure so , enabling you can to navigate and drill down into a workflow towards timeseries the time series level and even inspect the series in a graph or spatial plot.

Opening the Workflow Navigator
The Workflow Navigator (WN) can be started in two ways. :
From the Delft-FEWS Explorer - Map
, use:
- Use the <F12> menu
- and select option "K".
From the Delft-FEWS Explorer Taskbar
, when:
- When configured as an
- <explorerTask>.
Ad 1. Starting WN from the <F12>
...
Menu
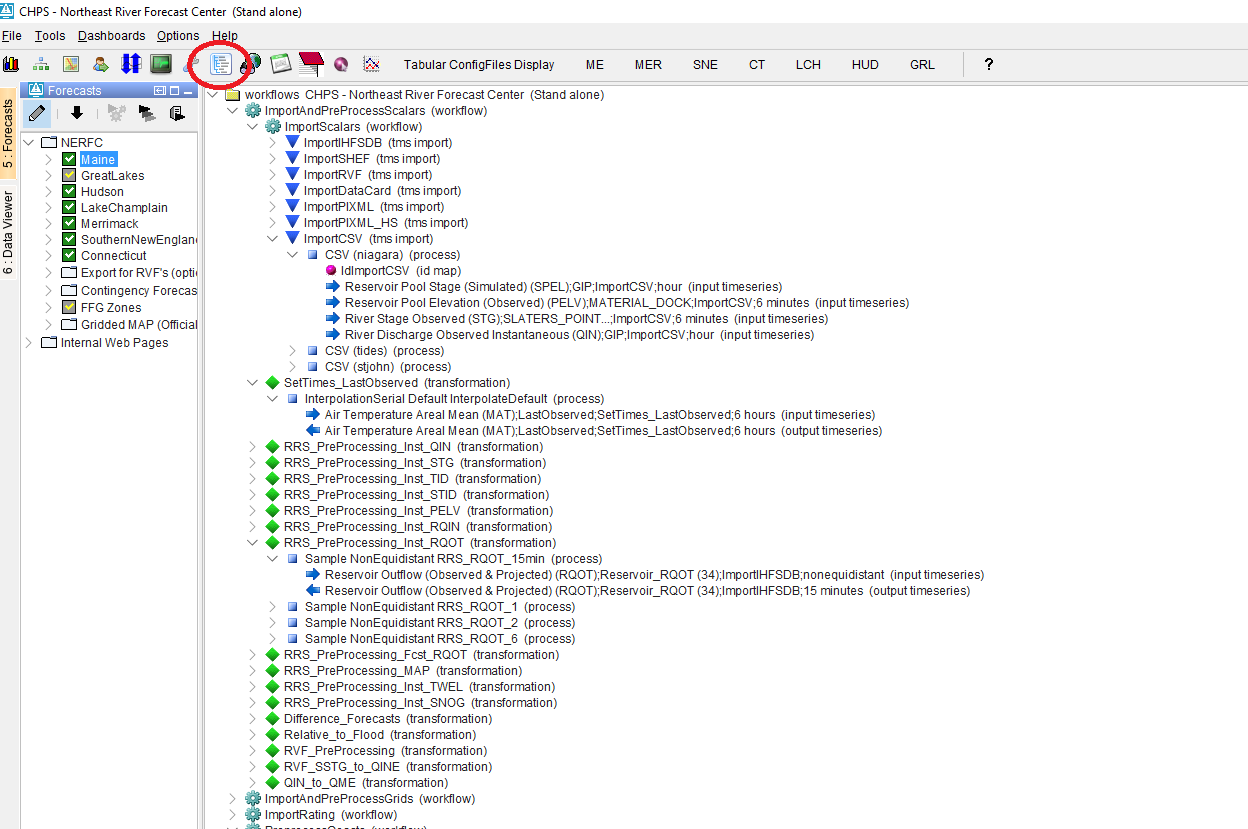
When you start the WN from the <F12> menu, all available (visible) workflows will be visualised visualized in the tree - structure. The WN itself opens in a "Worflow Workflow Navigator" Tab tab and can be (un) docked or undocked like all other tabs.
Ad 2. Starting WN from the Taskbar
When you start the WN from the Explorer taskbar, it will 'listen' to the selected workflow in e.g. , for example, your topology (forecast tree). Only that workflow will then be visible in the Workflow Navigator tab.
Logging
All relevant logging will appear in the Delft-FEWS Explorer log panel. From version 2018.02 (and higher), the log panel has been removed from the Workflow Navigator tab and is now centrally available in the Delft-FEWS Exporer Explorer log panel.
Usage of the Workflow Navigator
Workflows in a tree-structure
The Workflow Navigator (WN) displays presents the structure of the workflows in a clickable tree -structureformat. By selecting the nodes of within this tree, it expands and underneath , revealing the different parts components (steps) of the workflow(s) will be recognizable workflows, each identifiable based on its confuration configuration files. Drilling down Navigating deeper into this structure , the user is enabled to see all the different (related) configuration files (allows users to access all related configuration files and inspect them) even , right down to the input and output timeseries time series of individual 'steps' of within the selected workflow.
When you hover Hovering over a node in the structure , the reveals a tooltip displays displaying the corresponding configuration file and even displays additional information . Additionally, for transformation elements (when configured in the <description>, the tooltip may include additional information.
Temporary time series within your configuration are displayed in italics for easy identification.
 )
)
Icons
In the clickable tree-structure different icons are used. The table below explains the different icons used.
| Icon | Description |
|---|

| Workflow (general) |

| Timeseries import module |
| General adapter module |
| Transformation module |
| Old Transformation module |

| Error module |
| Threshold event crossing module |

| Forecast length estimator module |

| Process (any) |
| Unit conversion (process level) |

| Id mapping (process level) |

| Module parameters (process level) |

| Input timeseries (process level) |
| Output timeseries (process level) |
Context-menu options
When you open the Workflow Navigator (WN) , and select a certain specific node and press , pressing the right mouse button , will display the context menu will be visible.
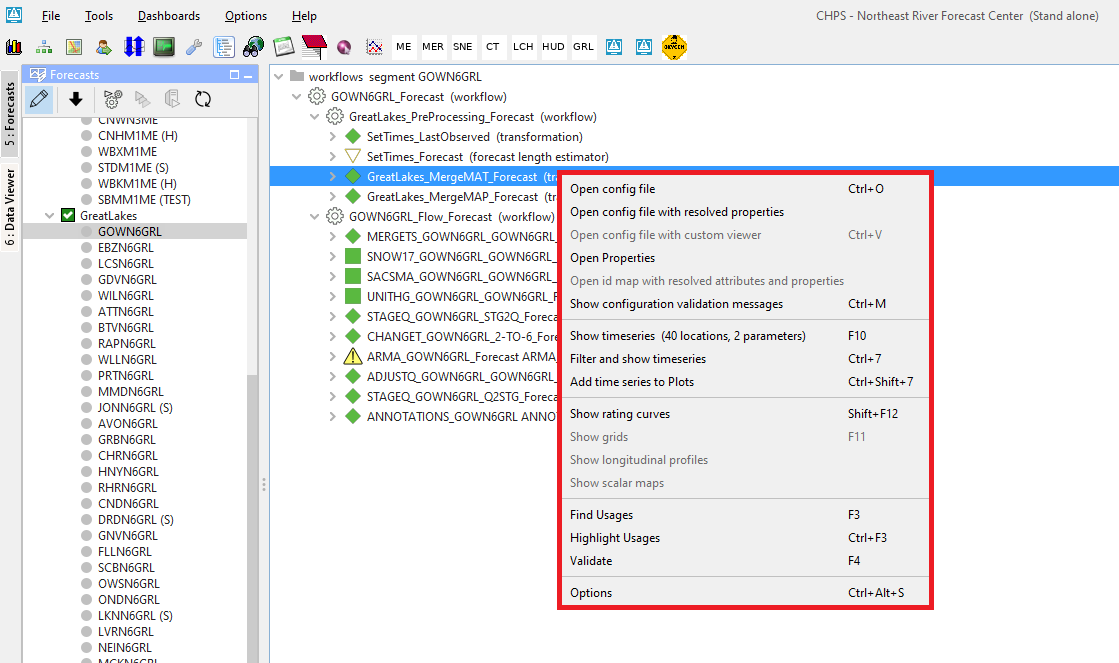

Depending on the hierarchy in the structure and node-type different options are available. Below mentioned table explains the different options.
| Context-menu option | Shortcut | Functionality |
|---|---|---|
| Open config file | Ctrl+O | Opens the corresponding configuration file (in a text-editor) |
| Open config file with resolved properties | Shows both the original module config file and the module config file with resolve properties ( in a comparison window) | |
| Open config file with custom viewer | Ctrl+V | Opens the corresponding configuration file (in a custom viewer) - Module parameters only |
| Open |
| Properties | Shows the values of the configured properties (variables between $-characters in a configuration file) | |
| Open id map with resolved attributes and properties | Shows the completed Idmap file in which the references to attributes and/or properties have been filled in. | |
| Show configuration validation messages | Ctrl+M | Shows the WARN or ERROR messages of the selected item (Workflow or ModuleInstance) |
| Show timeseries (n locations, m parameters) | Ctrl+6 | Opens a Timeseries dialog (TSD) for all n locations and m parameters in one plot |
| Filter and show timeseries | Ctrl+7 | Enables the user to select from a collection of timeseries based on location and module-instance(s). After selection a new plot window is opened showing the selected timeseries |
| Add timeseries to plots | Ctrl+Shift+7 | Enables the user to select from a collection of timeseries based on location and module-instance(s). After selection. the |
selected timeseries are added to the selected plot in the Timeseries display. | ||
| Show rating curves | Ctrl+8 | Shows the rating curve in a plot (if selected timeseries contains a rating curve) |
| Show grids | Ctrl+9 | Opens the spatial display to visualize the selected grid timeseries (only if selected timeseries is a grid) |
| Show longitudinal profile | Shows the longitudinal profile in a plot (if selected timeseries is a longitudinal profile) | |
| Show scalar maps | ||
| Find Usages | F3 | Based on the selected node, it finds identical references throughout the complete workflow list. The result is displayed in a separated panel. Pressing <ESC> cancels the selection. |
| Highlight Usages | Ctrl+F3 | Based on the selected node, the WN tree structure highlights similar references: bold means exact match, black means location match and greyed-out means no match. Pressing <ESC> cancels the selection. |
| Validate | F4 | Validates the selected node (which refers to a configuration file) against the corresponding schema. The log panel displays the result of this validation. |
| Options | F11 | Option to select to show "both visible and invisible workflows" or "only visible workflows". This setting is set in / read from the workflow descriptors configuration file. |