...
And export to Excel button has been added. Excel sheet will include all columns in display (so extra added location attribute column too)

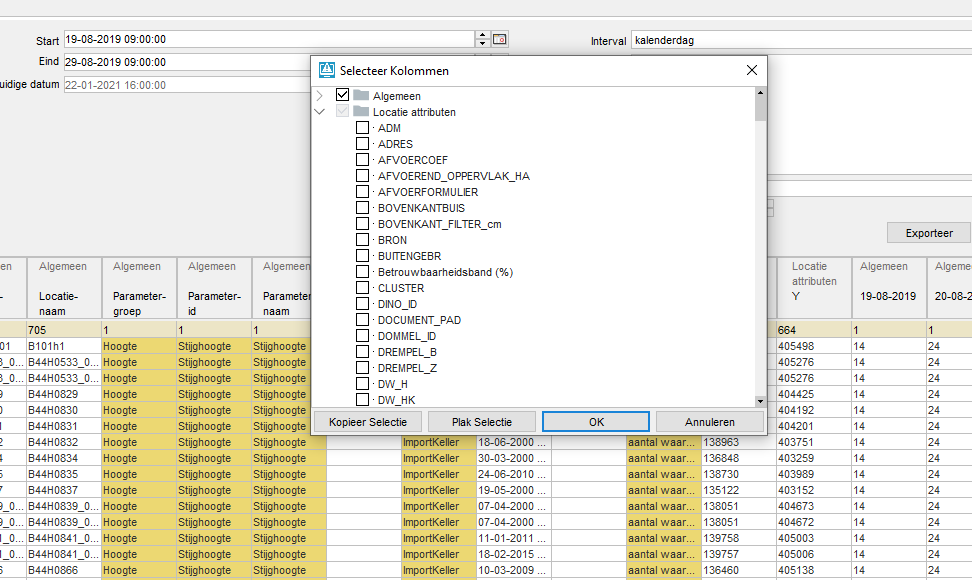
Starting from 2019.02 you can add extra columns based on location attributes to the display. For this, the user needs to right-click on the table and 'Select columns' (or shortcut key F8).
...
The following dialog will appear. Locations attributes can be selected and are saved per user. The attributes will follow the attribute name and if not defined the id. They are sorted alphabetically.
Custom flag sources added (since 2022.01)
Since 2022.01 also the custom flag sources are available as statistics.
| Code Block | ||||
|---|---|---|---|---|
| ||||
<?xml version="1.0" encoding="UTF-8"?>
<customFlagSources xmlns="http://www.wldelft.nl/fews" xmlns:xsi="http://www.w3.org/2001/XMLSchema-instance" xsi:schemaLocation="http://www.wldelft.nl/fews http://fews.wldelft.nl/schemas/version1.0/customFlagSources.xsd">
	<customFlagSource id="BAN" flag="100" name="Buiten bandbreedte"/>
	<customFlagSource id="128" flag="128" name="Custom128"/>
</customFlagSources> |

It must be taken into account that this only applies to the custom flag sources used as the normal flag source of time series. The optional and configurable FlagSourceColumns do not apply to this statistic.
Filtering
Since 2023.02 (backported to 2022.02). Rows can be filtered based on their respective percentage or value. Checking the corresponding check boxes will apply the filters to all rows of the associated type, percentage or value. Toggle whether a value range is inclusive or exclusive can be done with the outside checkbox.
