...
What | nameofinstance.xml |
|---|---|
Description | Configuration for the Report module |
schema location | httphttps://fewsfewsdocs.wldelftdeltares.nl/schemas/version1.0/reports.xsd |
...
Related pages
| Children Display |
|---|
...
Related TAG: $FILERESOURCE(resourceId)$
In the Report configuration file a <fileResource id="Plot1">Plot1.svg</fileResource> need t be added with an id. The fileresource file "Plot1.svg" is a file that need to be included in the \Config\ReportImageFiles\ folder.
In the report template file a TAG need to be included with the fileResource ID: <img src="$FILERESOURCE(Plot1)$">
Chart
In the Chart element the variableId's to be used for one or more charts are defined. The Chart ID that is defined is referenced in the TAG.
...
Chart should be configured according the following schema definition.

Figure 93 Chart definition according the ChartComplexType (reports.xsd).
...
The images configured in <plotBackgroundReportImage> and <plotForegroundReportImage> should be included in the config folder ReportImageFiles. The images are resized to fill the whole plot. The foreground image should be transparent. Below an example of the plot with the background image.

Multiple TimeSeries plots
...
A new feature in FEWS version 2021.01 is the option to create a chart using a direct reference to an existing Display ID in the DiplayGroups DisplayGroups configuration. You can configure this using the <DisplayChart/> element like this:
...
Using a classic <chart/> tag you have to reconfigure each chart separately for both the TimeSeriesDisplay on screen and the Report Export. The Benefit of this may be that you can optimize the way the charts look in a printed or web based report, which may have a different resolution, fonts and other features relative to the computer screen. However, if you just want the charts in the report to look the same as they do on the screen, using the existing Display ID in a <displayChart /> element can save you a lot of work. Optionally you can specifiy a fileName and fileFormat, the default output will be named chart00.png, chart001.png etc.
Please note that the displayChart feature currently requires a (default) period to be defined in the timeseriesSets used in the configuration.
Spatial plot snapshots
Gridded time series can be visualized in a report by means of snapshots. The snap shot is an image depicting the time series spatially.
...
Spatial plot snapshots are configured according to the following schema definition (sharedTypes.xsd). Since FEWS 2023.01 multiple class breaks are allowed. When multiple class breaks are configured in the best suitable class breaks are automatically chosen

snapshot
The snapshot is defined as a relative time interval from T0. Optionally a file name may be specified for the snapshot which is used to save the snapshot on the file system. If omitted the file name is generated by the report module. If required the date-time label can be adjusted (font type and font size)
...
The rowPerLocationHtmlTable can be configured directly in <report> section, or in the <declarations> section and reffered from the <report> section. This table is a generic table type and contains for each configured location one row with several columns. The data displayed in a particular column are result of the function that is configured for that column. Since 2024.01 also htmlColumn’s can be configured.
For each column For each column the following elements can be configured:
- header : text to display in the column header,
- format: format to use for this column. It refers to the styles that are available in the html template file
- width: width of the column
- backgroundColorFunction: function to determine the background color of the cells in the column (see below)
- foregroundColorFunction: function to determine the foreground color of the cells in the column (see below)
- function: function that determines/computes the value displayed in the column (see below)
backgroundColorFunction and foregroundColorFunction
These elements currently support the following functions:
For each htmlColumn the following elements can be configured:
- thTemplate: custom HTML for the table header
- Example 1 : <![CDATA[<th>Location name</th>]]>>
- Example 2: <![CDATA[<th class="data-status" style="color:#F9E11E">Max value</th>]]>
- tdTemplate: custom HTML for the table column
- Example 1 : <![CDATA[<td>%LOCATIONATTRIBUTE(shortname)%</td>]]>
- Example 2: <![CDATA[<td class="data-status" style="color:%THRESHOLDCROSSING
- THRESHOLDCROSSING(FIRST_THRESHOLDCOLOR; variableId)
- THRESHOLDCROSSING
- (MAX_THRESHOLDCOLOR;
- INDEXMAXWARNINGLEVELCOLOR(0; variableId)
- Hm)%">%THRESHOLDCROSSING(MAX_THRESHOLDNAME;Hm)%</td>]]>
backgroundColorFunction and foregroundColorFunction
These elements currently support the following functions:
- THRESHOLDCROSSING(FIRST_THRESHOLDCOLOR; variableId)
- THRESHOLDCROSSING(MAX_THRESHOLDCOLOR; variableId)
- INDEXMAXWARNINGLEVELCOLOR(0; variableId)
function
The existing report functions, that are also used in html-templates, can be configured in the columns. For example MAXVALUE(variableId; numberFormat) or LASTVALUETIME(variableId; dateFormat).
...
| Code Block | ||
|---|---|---|
| ||
<declarations> <rowPerLocationHtmlTableFormat id="rowPerLocationFormat1" tableStyle="tableStyle3" > <column> <header>Naam</header> <format>_data_yellow</format> <function>LOCATIONATTRIBUTE(shortname)</function> </column> <column> <header>Tijd maximale overschrijding</header> <function>THRESHOLDCROSSING(MAX_DATETIME;Qobserved;dateFormat1)</function> </column> <column> <header>Waarde maximale overschrijding (m3/s)</header> <function>THRESHOLDCROSSING(MAX_VALUE;Qobserved;numberFormat1)</function> function> </column> <column> <header>Tijd maximale waterstand</header> <function>MAXTIME(Hobserved;dateFormat1)</function> </column> <column> <header>Maximale waterstand (m)</header> <function>MAXVALUE(Hobserved;numberFormat1)</function> </column> </rowPerLocationHtmlTableFormat> </declarations> |
Example of the configuration with htmlColumn:
| Code Block | ||
|---|---|---|
| ||
<rowPerLocationHtmlTableFormat id="rowPerLocationHtml" tableStyle="tableStyle3"> <htmlColumn> <thTemplate> <![CDATA[<th>Location name</th>]]> </thTemplate> <tdTemplate> <![CDATA[<td>%LOCATIONATTRIBUTE(id)%</td>]]> </tdTemplate> </htmlColumn> <htmlColumn> <thTemplate> <![CDATA[ <th class="data-status" style="color:#F9E11E">Thresholds crossed</th> </column> ]]> </thTemplate> <tdTemplate> <column> <![CDATA[ <header>Tijd maximale waterstand</header> <td <function>MAXTIME(Hobserved;dateFormat1)</function> class="data-status" style="color:%THRESHOLDCROSSING(MAX_THRESHOLDCOLOR; Hobserved)%">%THRESHOLDCROSSING(MAX_THRESHOLDNAME;Hobserved;dateFormat)%</td> </column> <column> ]]> <header>Maximale waterstand (m)</header> tdTemplate> <function>MAXVALUE(Hobserved;numberFormat1)</function> </column> </rowPerLocationHtmlTableFormat>htmlColumn> </declarations> rowPerLocationHtmlTableFormat> |
rowPerLocationCSVTable
| Anchor | ||||
|---|---|---|---|---|
|
...
- id: unique identifier (as reference to this table);
- tableStyle: a choice of tableStyle which can be influenced by using the corresponding classes in a cascading style sheet. Choices are tableStyle1 to tableStyle10;
- column: indicates what (of one or more Timeseries) should be shown in the columns (options are: location, time, date, locationcritical, parameter, parameters, choice, allSeries);
- row: indicates what (of one or more Timeseries) should be shown in the rows (options are: location, time, date, locationcritical, parameter, parameters, choice, allSeries);
- relativeWholePeriod: definition of a moving period in time to be displayed (in the example above 24 hours before the day containing T0 of the forecast and 24 after the day containing T0 of the forecast (in total 3 days);
- topLeftText: definition of the text to be displayed in the upper left cell of the table;
- cellFormat: format of the cell containing the values;
- topFormat: Format of the column headers: "0,number,0.00" for a number, "0,date,dd/MMM" for a date.
- In combination with <column>location</column>, the topFormat specifies what should be written in the header of the column: "1" for location name, "2" for parameter name, "3" for parameter unit (N.B. use curly brackets in place of the quotation marks). Example: <topFormat>{1} - {2} ({3})</topFormat>
- In combination with <column>parameters</column> or <column>allSeries</column>, the topFormat element can be used to specify a custom column header for each data column. For a table with one data column just specify the custom column header in the topFormat element. For a table with multiple data columns, specify multiple custom column headers (one for each column), separated by "#" symbols, in the topFormat element. E.g. "header1#header2#header3". For parameters the headers can also use "0" for the parameter name and "1" for the unit name. The following example shows a configuration for a table with 2 data columns where the parameter name and value are displayed in the header: < topFormat >{0} {1}#{0} {1}</ topFormat >
- To use default headers instead of custom column headers, leave the topFormat element completely empty. If custom column headers are used, then there should be as many custom column headers as data columns in the table, otherwise a warning is logged and default column headers are used instead;
- leftFormat: format of the most left column;
- missingValueText: definition of the missing value character. Choices are: " ", "#", "" or "-"; Default: ""
- nullValueText: definition of the null value (NAN) indicator. Choices are: " ", "-", "-999", "no data";
- scrollable: Use this to split the table into two parts, one for the header row(s) and one for the data rows. The data row part refers to the tableStyle for this table with "_scrollable" appended. This can be used to make the data rows scrollable while the header row(s) remain fixed. For this to work the referred style needs to be defined in the report tables .css file.
- tableBackgroundColors: Override background colors in a HTML report for certain hours in the week. Works similar to: 02 Time Series Display Configuration (tableBackgroundColors)
...
Since 2013_01 it is possible to create reports of Schematic Status Display panels in the form of animations in the formats Avi and animated gif as well as snapshots in the form of Png files and Svg files.
For this purpose there will probably already be some Schematic Status Display configuration in the DisplayConfigFiles of the configuration. In order to create a report of a Schematic Status Display panel, most elements of this configuration can be copied manually to the reports configuration file. For configuring a Schematic Status Display panel please refer to Schematic Status Display configuration.
An example Schematic Status Display that contains the following configuration,
...
| Code Block | ||||
|---|---|---|---|---|
| ||||
<reports xmlns="http://www.wldelft.nl/fews" xmlns:xsi="http://www.w3.org/2001/XMLSchema-instance" xsi:schemaLocation="http://www.wldelft.nl/fews httphttps://fewsfewsdocs.wldelftdeltares.nl/schemas/version1.0/reports.xsd" version="1.0"> <declarations> <defineGlobal id="ForecastingRegion">IWP-Twentekanalen</defineGlobal> <dateFormat id="DF1"> <timeZone> <timeZoneName>CET</timeZoneName> </timeZone> <pattern>dd-MM-yyyy</pattern> </dateFormat> <numberFormat id="NF1">{0,number,##0.00}</numberFormat> ... </declarations> <report> ... // Add Ssd report elements here for generating Avi, Gif, Png or Svg. ... </report> </reports> |
...
schematicStatusDisplayPanelSnapshotsSvg
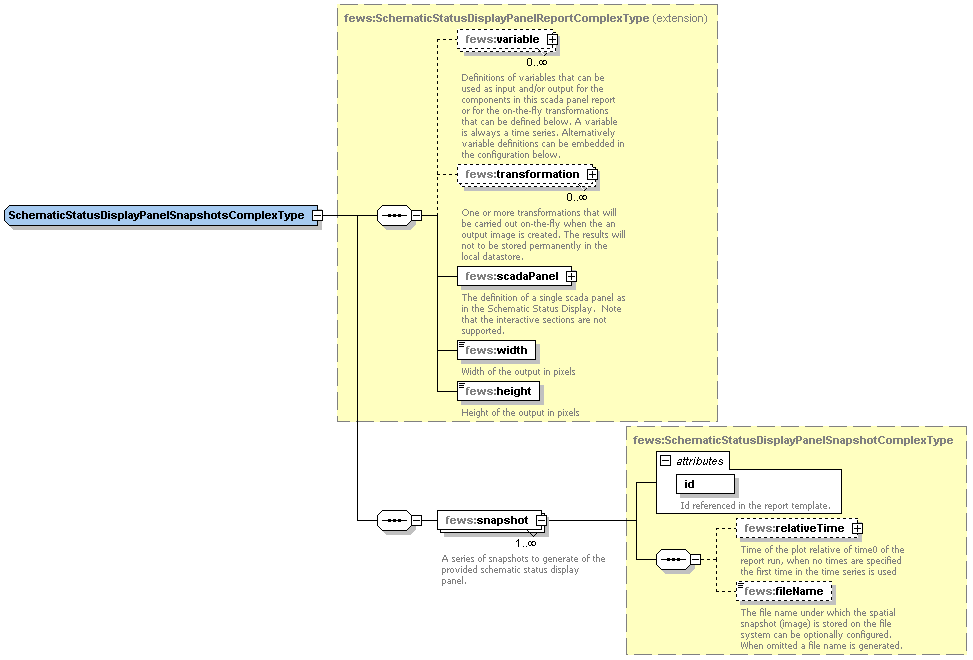
| Code Block | ||||
|---|---|---|---|---|
| ||||
<schematicStatusDisplayPanelSnapshotsSvg> <scadaPanel id="TK" name="Twentekanalen 10 min"> .... </scadaPanel > <width>1024</width> <height>800</height> <snapshot id="ssd1"> <relativeTime unit="hour" value="-4"/> <fileName>SSD_test4.svg</fileName> </snapshot> <snapshot id="ssd2"> <relativeTime unit="hour" value="-3"/> <fileName>SSD_test5.svg</fileName> </snapshot> </schematicStatusDisplayPanelSnapshotsSvg> |
From the FEWS version 2018.02 it is possible to configure filename prefix and suffix for schematicStatusDisplayPanelSnapshotsPng and schematicStatusDisplayPanelSnapshotsSvg reports.
...