| scrollbar |
|---|
| Table of Contents |
|---|
Dropdown Menu
File
The File Menu in the Operator Client of Delft FEWS offers you the possibility to log into and out of the Master Controller:

In the Standalone system the File Menu only allows you to reload you configuration:

Log in
With Log in, an on-line session can be started. When logging in, the system may require some time for synchronising new data from the Central Database.
A range of synchronisation profiles can be selected:
- Minimal
This profile synchronises a minimum amount of data required for a forecaster to perform the required tasks. As a default, data is synchronised over the past 2 days and no radar and grid data is transferred to the OC. This profile should be used, when logging in over a dial-in connection.

- Full
This profile synchronises a larger amount of data required for a forecaster to perform the required tasks and have sufficient background data available. As a default, data is synchronised over the past 7 days.
- Custom
With this profile a user can determine over which period data should be downloaded.
In addition, a user can select to download:
- Simulated Grid Data (e.g. flood maps)
- External Grid data (e.g. radar grids, surge forecast grids)
- Complete configurations (all versions of the configuration files in the database including the module datasets)
- Radar forecasts and actuals (catchment average time series)
- Performance indicators
- Warm states

The period over which data should be downloaded can be defined by the user.
Log out
With Log out, an on-line session can be closed without closing the FEWS menu. Work can be continued in an off-line mode. When logging out the following window appears:

Before logging out, the system will complete a ongoing synchronisation action. Depending on the action this may take from seconds to several minutes.
Reload Configuration
drop-down menu bar provides access to all displays that are configured for your specific setup of FEWS.

Load/Save/Default Layout
By default Delft-FEWS will start with the map display opened in the centre section of the display and the forecast panel opened on the left side (see Figure 4‑4) . A first step in customizing the display layout is to manually arrange the display layout by:
Drag and drop tabs from the left to the right side
- Open panel tabs on the left and right side
After finishing the rearrangement go to File and Save Layout, to save the setting when opening the application again (see Figure 4‑5). To reload the saved layout while working in the application got to File à Load Layout.
Reload default user settings
Reloads the user settings to a default setting.
Export timeseries
This menu option opens the “Export Time Series” dialog.

This dialog box can be used to filter the selected time series based on view period, module instance, reliability, and status. Once the filter options are selected, the time series that match the given criteria are saved to a file.
When the user selects “unreliable” in the Export Time Series dialog, only export formats that write quality flags are available. These include PI XML files, CSV files with quality flags, and Dutch CSV files with quality flags.
If “unreliable” is not selected in the Export Time Series dialog, then all export formats are available. This is necessary because if unreliable values were exported without quality flags, it would not be possible to identify which values are unreliable in the exported file. In the case of CSV format with quality flags, the complete text of the quality flags (including STATE and DETECTION flags, if they exist) are added to the time series.
The available export formats in the Export Time Series dialog are:
- PI XML
- GIN XML
- CSV, Dutch CSV
- CSV with Quality Flags
- Dutch CSV with Quality Flags
- iBever CSV
- Hymos Transfer DB 4.50 MDB
- Hymos Transfer DB 4.03 MDB
- Menyanthes CSV
- UM Aquo 2009 XML
For more information, see: Interactive Export
Dock all undocked windows
Available since 2020.02. Clicking it docks all undocked windows.
Temporary import
Available since 2021.02, this feature provides a simple option to temporarily import files in PI XML, NetCDF, or CSV format. This allows you to inspect files without first having to configure a specific import and display.
1D time series (scalar) can be imported using either PI XML or NetCDF. Additionally, the NetCDF format also allows the import of 2D grid data for a single time step. The imported data is not stored in the datastore and will be disconnected when you exit the FEWS Explorer UI.
Please note that NetCDF is a very flexible format, so not every NetCDF file will be imported successfully. FEWS will try to use the NetCDF CF convention to identify location, parameter, and time-related dimensions. For 1-D scalar data, the NETCDF-CF_TIMESERIES import type is assumed, and for 2D grid data, the NETCDF-CF_GRID import type is used.
For the import of CSV format, some configuration is required. A Table Layout needs to be defined to control which columns of the CSV file contain location ID, parameter ID, and date/time information. The table layouts to use are to be configured in the explorer.xml config file.
|
For the CSV import, the General CSV parser is utilized. This means it might be possible to copy the table definition from an existing CSV import configuration. Multiple table definitions can be configured, each with a unique name. After this, the user will be prompted to select a table definition to use for the import.
Reload Configuration
This allows you to In the Standalone system you can reload your configuration from the file system without having to close your client. This may be is practical when you have changed some configuration files and want to check the result results of the changes.
Exit
With "Exit," a forecasting session can be closed.
Tools
Plug-ins to for the FEWS Explorer are activated primarily through the Tools menu. The following
plug-ins may be configured (an example examples of some is are shown in the picture below):
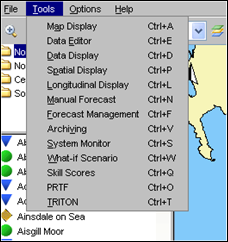

Map Display
The current map view will be opened in a new window when selecting this option.
Data Editor
By selecting Data Editor, time series can be displayed and edited in the form of tables. (see also Data Display and Editor ).
Data Display
By selecting Data Display, time series can be displayed in graphs (see also Data Display and Editor ).
Spatial Display
By selecting Spatial Display, meteorological forecast grids or hydrological flood maps and catchment average data can be displayed on a map (see also Spatial Display ).
Longitudinal Display
The Longitudinal Display is for example used to display data for the axis of the river or along the coast (see also Longitudinal Display ).
Manual Forecast
Via the Manual Forecast Display, the user can define forecasts that should be run in manual mode (see also Manual Forecasts ).
Forecast Management
Via the Forecast Management Display, the user can download forecasts from the Central Database and make forecast active for viewing. The current forecast can be set and archived forecasts can be retrieved. (see also Forecast Management ).
Archiving
Archiving allows you to archive and retrieve forecast runs with all associated data to/from an repository. Also threshold crossing events, time series and configuration can be archived. You can only retrieve to a standalone system.
System Monitor
The System Monitor allows the user to view selections of system messages and acknowledge severe and fatal errors (see also System Monitor ).
What-if Scenario
Via the What-if Scenario Display, the user can define what-if scenarios, which can be run via the Manual Forecast Display. (see also What-if Scenarios ).
Skill Scores
The Skill Scores display provides an overview of all threshold crossings in the observed and forecast time series. By matching observed and forecast thresholds crossings, the skill scores, which are shown at the bottom of the display, are obtained.
LookUp Table
The Lookup Table display allows for working with lookup tables interactively and run what-if scenarios on them (see also Lookup Table Display ).
Correlation
The Correlation display allows for working with interactive regression functions and make alternative (off-line) forecasts
Calibration
The Calibration display allows a user to automatically optimize the model calibration parameters.
Threshold display
The Threshold displays allows for extended reviewing of all thresholds.
Other displays
Also displays specifically focussed focused on a particular forecast procedure or method- like PRTF, TRITON, K-Flows and Trends in NFFS for England and Wales- can be accessed from this menu.
Part of the functionality offered by the Tools menu is usually also (partly-) available via the Button Bar.

Options
Through the Options Menu a number of settings can be defined.

Map
The Map Tab allows the user to activate or de-activate the:
- scale bar
- north arrow
- labels


Status Bar
The Status Bar Tab allows the user to activate the display on the Status Bar of:
- GMT time
- Current time
- Time of last refresh__
- System status__
- Mouse co-ordinates__
...

- User name: Displays the person's name.
- User group: Displays the group that the person is part of.
- Current time: Displays the current system time.
- GMT: Displays the GMT time.
- Time of last refresh: Indicates the last time the local
...
- datastore was synchronized with the Central Database.
...
- System status: Indicates the mode the system is currently operating in: online, offline
...
- , or stand-alone.
- Mouse
...
- coordinates: Displays the mouse pointer
...
- coordinates in a configurable format (e.g., OSGB 1936 format for NFFS).
...
- I/O speed: Indicates the input/output speed, reflecting how quickly data is being read from or written to the system’s storage.
- Memory usage: Displays the amount of system memory currently being used.
Tool Bars

Current System
...
Time
The Current System Time Tab tab allows the user to set the current system time. This is the time , that should be simulated by the system. Under normal operational conditions, the current system time coincides with the actual time. For hindcasting, the current system time can be set at to a user-defined time.


The current system time can only be changed in a Standstand-alone system. In an Operator Client, this item is disabled.
Help
The Help Menu provides:
- AboutContents F1Contents
- Help


Contents
Contents give access to the context sensitive Help information. The On-line HELP provides:
- Logical grouping of topics (Contents Tab)
- An Index (Index Tab)
- A search option (Search Tab)
.pdf (if configured), which is the usual manual that comes with your FEWS-system. For specific displays, it might have been configured that you will be linked directly to this WIKI.
Buttons are available at the top of the window to increase the size of the display window by closing the overview panel (Hide ), navigate back and forward through the HTML pages opened before (Back and Forward ) and print the information (Print ).
About
Via About background information regarding the Delft FEWS version can be displayed. The software version and build information is displayed. In addition, technical data is presented regarding the actual allocation of memory to the Delft FEWS application.

