The following paragraphs show some Some examples on how to connect to the FEWS PI-JSON REST Web Service:
Python
To get time series from FEWS using python the following example uses the requests module and reads the time series data into a dictionary.
| Code Block | ||
|---|---|---|
| ||
import requests url = 'http://localhost:8080/FewsWebServices/rest/fewspiservice/v1/timeseries' params = dict( documentVersion='1.23', documentFormat='PI_JSON' ) response = requests.get(url=url, params=params) data = response.json() |
To see an example of creating a time series plot with python using matplotlib, see see the following Python Matplotlib time series example.

To see an example of creating a locations.csv and attributes.csv with python, see the following Python Locations and Attributes example.
Javascript
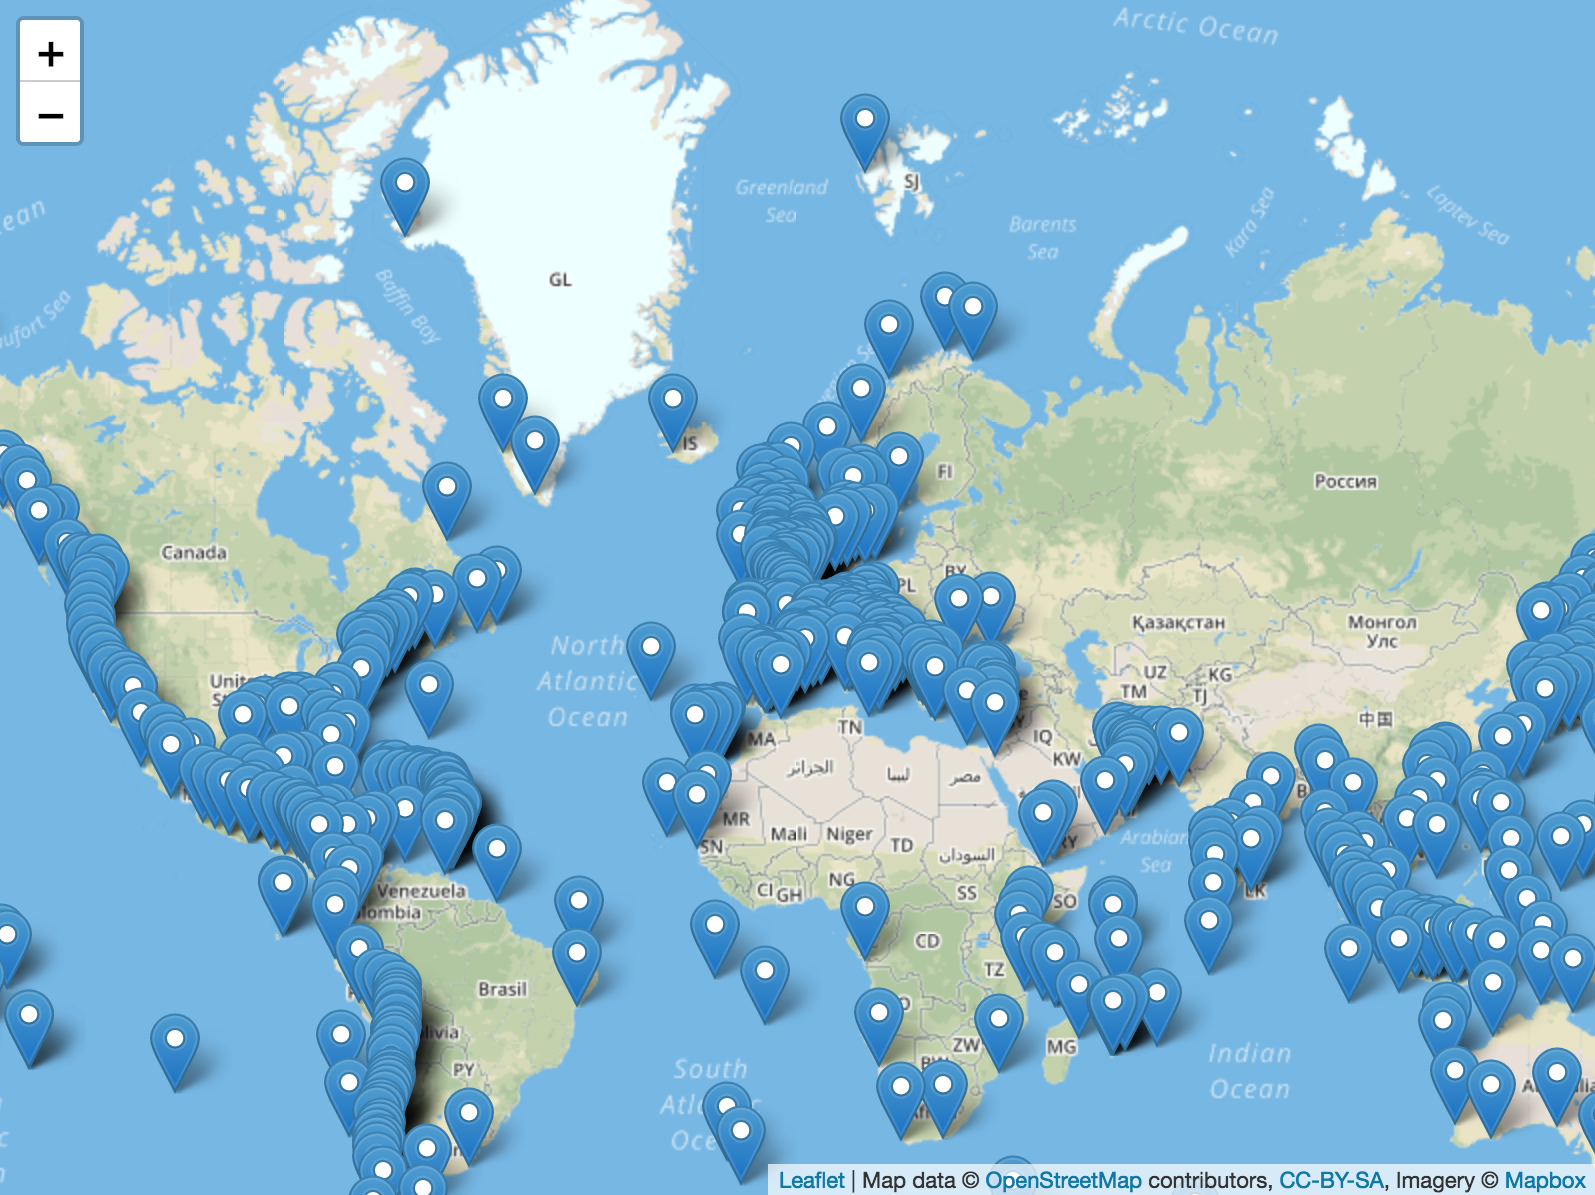
locations plot
Using popular javascript libraries like leaflet, jquery and mapbox a web application can be made using the FEWS PI-JSON REST Web Service. The following example shows how to get all locations from FEWS and plot them on a map:
This requires For the following html/ javascript code see:
...
| language | xml |
|---|
...
time series plot
Getting time series from the FEWS
...
PI-JSON
...
REST
...
Web
...
Service using javascript can be easily done using jquery. The following example uses the the morrisjs plot library to display the time series.

For the javascript code see: JavaScript time series plot