...
| Table of Contents | ||||
|---|---|---|---|---|
|
| Children Display |
|---|
Report Module Configuration
The role of the report module is to generate reports of the forecast results in a form that can easily be displayed without using DELFT-FEWS on a web server. Reports that are produced by DELFT-FEWS serve two purposes:
...

Figure 89 Elements of the Reports configuration
Configuring formatting of reports
declarations
Root element for declaring variables and formats to be used in making the report.

Figure Elements of the declarations configuration
defineGlobal
The DefineGlobal element can be used to enter some information that is valid for all reports. Multiple DefineGlobal elements may be defined, as long as the ID attribute is kept unique.
Related TAG: $DEFINITION(definitionId)$
<item>Format
Formatting instructions for a specific item in the report.
templateDir
Root directory of the directory containing report templates.
reportRootsDir
Root directory to which the all reports are to be exported. This directory is typically the root directory of the web server
Note: A global.properties tag may be useful to define this directory
reportRootsSubDir
Root directory to which the current reports are to be exported. This directory is relative to the reportsRootsDir
sendToLocalFileSystem
Boolean option to determine if reports are to be written to the file system on creation. If set to false reports will be stored in the Reports table in the database, pending export through the ReportExport module.
temporary
When temporary the reports are only available for the report export module executed in the same run. The reports are not saved to the database but instead to a temp file that is deleted at the end of the run
Configuring content of reports
report
Root element for defining the data to be included in the report.

Figure 91 Elements of the Report configuration
InputVariable
Input timeseriesSets for the report. All timeSeriesSets that are used in the report must be defined here, both for carts and for tables. See Transformation Module for details on defining an inputVariable element.
FileResource
Reference to an external file that must be copied with the report. The file will be copied to the same location as the report, with the correct filename inserted at the place of the tag. This can be used for copying images.
Related TAG: $FILERESOURCE(resourceId)$
Chart
In the Chart element the variableId's to be used for one or more charts are defined. The Chart ID that is defined is referenced in the TAG.
Related TAG: $CHART(chartId)$
Summary
In the Summary element the variableId's are specified that are used to create the summary information. The OverlayFormat of the SummaryFormat determines what is shown on the map.
Related TAG: $SUMMARY(summaryId)$
Table
In the Table element the variableId's are specified that are used to create a table. The TableFormat controls how the table is formatted, i.e. the row and column information and how the data is displayed in the map.
Related TAG: $TABLE(tableId)$
See for more information
Status
The Status element links a Status ID that is referenced in the STATUS TAG to a Status Format ID.
Related TAG: $STATUS(statusId)$
Template
Template file name to be used for the report.
OutputSubDir
Optional output subdirectory for this report.
If singleLocation is true, then outputSubDir can contain location attribute ids, e.g. "H_ (BASIN)", where tags between "@" signs refer to location attributes that are defined in the locationSets config file. These tags will be replaced with the corresponding attribute values of the location of the report. These values can be different for different locations. See 22 Locations and attributes defined in CSV files, Shape-DBF files or external tables for more information. If required to use a "@" sign in this element without using locationAttributes, then need to add an extra escape character "@" before each "@" sign. In other words "@@" is replaced with a single "@" sign.
OutputFileName
Output file name for this report.
...
- %LOCATIONID%
- %TIMESERIES_POSTFIX(dateFormatId)%
- %CURRENTTIME(dateFormatId)%
- %TIMEZERO(reportVariableId;dateFormatId)%
- %TIMESTEP(dateFormatId)% (only supported for spatialPlotSnapshots snapshot fileNames).
%LOCATIONID %
If singleLocation is true, then can use tag %LOCATIONID% here, which will be replaced with the id of the location of the report. If singleLocation is true, and the %LOCATIONID% tag is not present, then a "_" sign and the id of the location of the report will be inserted automatically just before the "." sign in the filename.
Additionally, if singleLocation is true, then outputFileName can contain location attribute ids, e.g. "H_ (BASIN)", where tags between "@" signs refer to location attributes that are defined in the locationSets config file. These tags will be replaced with the corresponding attribute values of the location of the report. These values can be different for different locations. See 22 Locations and attributes defined in CSV files, Shape-DBF files or external tables for more information. If required to use a "@" sign in this element without using locationAttributes, then need to add an extra escape character "@" before each "@" sign. In other words "@@" is replaced with a single "@" sign.
%TIMESERIES_POSTFIX(dateFormatId)%
The TIMESERIES_POSTFIX tag will be replaced by the minimum date of the configured timeSeries in the report. If no timeSeries have been configured, the system date will be used. An optional dateFormat id can be specified. For example: %TIMESERIES_POSTFIX(dateFormatId)% where dateFormatId is the id of a dateFormat as specified in the reports declarations. If no dateFormatId is passed, the default date format ddmmyyyym will be used.
%CURRENTTIME(dateFormatId)%
The CURRENTTIME tag will be replaced by the current system time. An optional dateFormat id can be specified (see TIMESERIES_POSTFIX).
%TIMEZERO(reportVariableId;dateFormatId)%
The TIMEZERO tag will be replaced by the minimum T0 of the timeSeries configured by the reportVariableId. If no parameter is configured, T0 of the task run will be used. The reportVariableId is optional.
...
N.B.: Be careful in specifying date formats that are compatible with the filesystem. For example and : in the dateformat will not be compatible with the windows filesystem.
%TIMESTEP(dateFormatId)%
The TIMESTEP tag will be replaced by the timestep of a spatialPlotSnapshots snapshot. An optional dateFormat id can be specified. For example
| Code Block |
|---|
<snapshot id="Waterlevel_0"> <relativeTime unit="hour" value="0"/> <fileName>Report.EAM.Waterlevel.FC_%TIMESTEP(df1)%</fileName> </snapshot> |
DefineLocal
The DefineLocal element can be used to enter some information that is valid for a single report. Multiple DefineLocal elements may be defined, as long as the ID attribute is kept unique.
...
If singleLocation is true, then the value of a defineLocal element can contain location attribute ids, e.g. "H_ (BASIN)", where tags between "@" signs refer to location attributes that are defined in the locationSets config file. These tags will be replaced with the corresponding attribute values of the location of the report. These values can be different for different locations. See 22 Locations and attributes defined in CSV files, Shape-DBF files or external tables for more information. If required to use a "@" sign in this element without using locationAttributes, then need to add an extra escape character "@" before each "@" sign. In other words "@@" is replaced with a single "@" sign.
Charts
Charts can be used for visualizing timeseries. The charts which can be added to html-reports look more or less the same as in the TimeSeries Display. The configuration is simular to display groups. Charts are being created as (individual) *.png files.

Figure 92 Example of a chart (*.png file)
Template tag
In the Chart element the variableId's to be used for one or more charts are defined. The Chart ID that is defined is referenced in the TAG.
Related TAG: $CHART(chartId)$
Configuration aspects
Chart should be configured according the following schema definition.
...
The display of threshold lines are supported for one y axis. But there can be threshold lines for either the left or the right y axis, but not both. Note that further constraints on what thresholds are displayed is possible in the reports schema.
Multiple TimeSeries plots
To assign a timeseries to the left or right y axis use the <axis> element. This element is optional and leaving it out will assign it (default) to the left axis. Please note that at least one timeseries should be on the left axis (by either settings <axis>left</axis> or leaving the element out and using the default).
...
|
|

Stage/discharge plots
When a discharge is displayed, it is possible to show the stage on the right axis. It is not possible to configure this rating on the left axis (and the timeseries on the right axis), since a plot has to have at least one timeseries on the left axis.
...
- Chart attributes;
- Chart timeseries;
Chart attributes
To display the chart the following attributes need to be defined:
- Id: unique identifier for this chart (unique in this report);
- formatId: referring to the format of this chart (in declaration section of the report)
- height: an integer value for the height of the chart in pixels;
- width: an integer value for the width of the chart in pixels;
Chart timeseries
To display lines, dots etc. of a certain timeseries, the reference to this timeseries (variableId) should be mentioned.

Figure 94 chart declaration in the report section
Rotated Markers
Since 2017.02 FEWS supports the possibility to plot arrows markers showing direction on plots, which for example can be used to create a plot of wind speed where the arrow markers signify the wind direction. The report module also supports such markers. Configuration for these markers must be included in the TimeSeriesDisplayConfig.xml, as described in the Time Series Display Configuration Guide under the "Directional arrow markers" section. In addition, for the direction time series to be available in the report module, the direction time series must be included in the chart in addition to the speed time series. The direction time series is NOT added automatically.
Spatial plot snapshots
Gridded time series can be visualized in a report by means of snapshots. The snap shot is an image depicting the time series spatially.
Configuration aspects
Spatial plot snapshots are configured according to the following schema definition (sharedTypes.xsd)

snapshot
The snapshot is defined as a relative time interval from T0. Optionally a file name may be specified for the snapshot which is used to save the snapshot on the file system. If omitted the file name is generated by the report module. If required the date-time label can be adjusted (font type and font size)
...
If fileNamePrefix is configured it will add the system time date to the beggining of file name in the configured format. If fileNameSuffix is configured it will add the system time date to end of the file name in the configured format. Please note, it is possible that not all modules support the fileNamePrefix and fileNameSuffix.
Summary
A summary is a (background) map which can be added to a report. On top of this map, icons can be displayed. The icons indicate the location or the (warning) status of the monitoring or forecasting point. By adding specific html-functionality to the report template(s), maps can be used to navigate through the reports as well. Clickable areas and locations can be distinguished here. The map itself (as a file) can be any image file. For displaying maps in html-reports the following formats are advised: *.png, *.jpg or *.gif.
Template tag
In the Summary element the variableId's are specified that are used to create the summary information. The OverlayFormat of the SummaryFormat determines what is shown on the map.
Related TAG: $SUMMARY(summaryId)$
Creating a summary
The map itself is an existing file and can be created in several ways. An image processing software package (like Paint Shop Pro) can create a 'screendump' from the map section of The FEWS-Explorer. The FEWS-Explorer itself has some hidden features which can be used as well. The [F12] button can be used for:
...
Remark: Every time you use the above mentioned [F12] features, the png file in the /bin directory and the clipboard is overwritten! In making series of maps you should copy/rename your png file after using this option. You should also paste the map extent in a text editor or spreadsheet directly before repeating the operations with another map extent in the FEWS-Explorer.
Configuring a summary
Declaration section
In the declarations section of the report ModuleConfigFile, the summaryFormat needs to be declared. The following elements should be specified (see figure).
...

Figure 95 Summaryformat in the declarations section
Detailed explanation
- File details like width and height can be retrieved using image processing software.
- The x0 and y0 elements are margins/shifts of the position of the map compared to the left-upper point of the report (e.g. an A4-sheet). This left-upper point is (0,0). The x0/y0 refer to the left-upper point of the image.
- The mapFormat is used for positioning the map on the page (relative to all other content) and therefor it is placed in a so-called [DIV] tag. This type of html tag puts everything which is configured within that tag in that position on the page. The following table explains the references of the number in this format:
...
The mapFormat and overlayFormat elements are configured in html language in which some parts needs to be dynamically filled in. The result will be valid html. The map itself is placed as the bottom 'layer' using the <DIV> tag attributes (index="0") in the mapFormat. Objects defined in the overlayFormat are given higher indices to place them 'on top of the map' and will always be visible (location icons, warning icons).
Use of optional settings in mapFormat and overlayFormat
In both formats, an optional item can be specified.
Clickable map
A clickable map is an image on a html page containing 'hot spots' where the cursor change from the normal 'arrow' to a 'pointing finger' during a mouse-over event. These hot spots can contain hyperlinks to other pages.
...
To avoid hot spots on a map, do not include the "usemap="{5}" in the mapFormat.
Hyperlinks
Hyperlinks can be added to the overlayFormat. By using the following option, hyperlinks to individual reports will be added automatically. They will have a fixed (non-configurable) name, "forecastlocation.html" and assuming it is located in a directory with the same name as the locationId compared to where this report with the map is located in the directory structure.
...
The overlayFormat element can also contain location attribute ids, e.g. " (BASIN)", where tags between "@" signs refer to location attributes that are defined in the locationSets config file. These tags will be replaced with the corresponding attribute values for each location. These values can be different for different locations. See 22 Locations and attributes defined in CSV files, Shape-DBF files or external tables for more information. If required to use a "@" sign in this element without using locationAttributes, then need to add an extra escape character "@" before each "@" sign. In other words "@@" is replaced with a single "@" sign.
Report section
A summary can be added to a report configuration as shown below.
...
- Id: identifier referring to the tag in the template. In this case the corresponding template will contain $SUMMARY(statusAreaMap)$
- formatId: identifier referring to the unique identifier of this map in the declarations section.
- timeSeries: reference to an inputVariable (declared in the report or in the declarations section).
- mapId: reference to a valueAttributeMap;
Tables (overview)
Tables are available in different types. The similarity between them is that they are referenced with the same template tag.
Template tag
In the Table element the variableId's are specified that are used to create a table. The TableFormat controls how the table is formatted, i.e. the row and column information and how the data is displayed in the map.
...
Tables 2 to 6 have references to cascading style sheets. Below the different tables are explained.
htmlTable
The htmlTable is the successor of the table described earlier. The configuration of this htmlTable is easier and more readable.
Declarations section
In the declarations sections a format of a table needs to be defined. In the figure below, a format of a htmlTable is configured.
...
- id: unique identifier (as reference to this table);
- tableStyle: a choice of tableStyle which can be influenced by using the corresponding classes in a cascading style sheet. Choices are tableStyle1 to tableStyle10;
- column: indicates what (of one or more Timeseries) should be shown in the columns (options are: location, time, date, locationcritical, parameter, parameters, choice, allSeries);
- row: indicates what (of one or more Timeseries) should be shown in the rows (options are: location, time, date, locationcritical, parameter, parameters, choice, allSeries);
- relativeWholePeriod: definition of a moving period in time to be displayed (in the example above 24 hours before the day containing T0 of the forecast and 24 after the day containing T0 of the forecast (in total 3 days);
- topLeftText: definition of the text to be displayed in the upper left cell of the table;
- cellFormat: format of the cell containing the values;
- topFormat: Format of the column headers: "0,number,0.00" for a number, "0,date,dd/MMM" for a date.
- In combination with <column>location</column>, the topFormat specifies what should be written in the header of the column: "1" for location name, "2" for parameter name, "3" for parameter unit (N.B. use curly brackets in place of the quotation marks). Example: <topFormat>{1} - {2} ({3})</topFormat>
- In combination with <column>parameters</column> or <column>allSeries</column>, the topFormat element can be used to specify a custom column header for each data column. For a table with one data column just specify the custom column header in the topFormat element. For a table with multiple data columns, specify multiple custom column headers (one for each column), separated by "#" symbols, in the topFormat element. E.g. "header1#header2#header3". For parameters the headers can also use "0" for the parameter name and "1" for the unit name. The following example shows a configuration for a table with 2 data columns where the parameter name and value are displayed in the header: < topFormat >{0} {1}#{0} {1}</ topFormat >
- To use default headers instead of custom column headers, leave the topFormat element completely empty. If custom column headers are used, then there should be as many custom column headers as data columns in the table, otherwise a warning is logged and default column headers are used instead;
- leftFormat: format of the most left column;
- missingValueText: definition of the missing value character. Choices are: " ", "#", "" or "-";
- nullValueText: definition of the null value (NAN) indicator. Choices are: " ", "-", "-999", "no data";
- scrollable: Use this to split the table into two parts, one for the header row(s) and one for the data rows. The data row part refers to the tableStyle for this table with "_scrollable" appended. This can be used to make the data rows scrollable while the header row(s) remain fixed. For this to work the referred style needs to be defined in the report tables .css file.
- tableBackgroundColors: Override background colors in a HTML report for certain hours in the week. Works similar to: 02 Time Series Display Configuration (tableBackgroundColors)
Report Section
In the report itself the reference to a tableFormat and the declaration of the content should take place. The schema prescribes as follows:
...
Remark: htmlTables can contain more than one timeseries. By adding different cellFormats to the series (see picture above) different styles can be attached for display in the table. In this way you can distinguish the two timeseries in the table!
Detailed explanation
The choice of adding a certain tableStyle to a table supplies you with the opportunity to influence the looks and style of the table, its borders, background and content. By setting the tableStyle a number of style classes are being generated in the html-pages. By declaring these classes in a stylesheet (*.css) and ascribe a certain font family, font size, border color, background color etc. you are able to 'polish' the looks of your reports. If a tableStyle class is not mentioned in a stylesheet, it is being displayed using default settings.
...
class | description | specific for |
_beforeT0 | date/time indication before time zero (TO) of the forecast | time column (most left column) |
_firstAfterT0 | date/time indication of the first occurrence after time zero (T0) of the forecast | time column (most left column) |
_afterT0 | date/time indication after time zero (TO) of the forecast | time column (most left column) |
_data | default indication of data content of a cell | data cells |
_anyString | user defined cellFormat | data cells |
_datamax | addition to current style if value is maximum of that series (_data_datamax or _anyString_datamax) | data cells |
_leftcol | default indication of a row header |
|
_header | default indication of a column header |
|
_threshold_n | indication of threshold level (n=0,1,2,...) | threshold tables (colouring of backgrounds) |
thresholdsCrossingsTable
| Info |
|---|
Notice: the thresholdCrossingsCountTable (see further below) is a newer version of this type of table |
...

Figure 99 Example of a thresholdCrossingTable (NE Region)
Declarations section
In the declaration sections the layout of the table needs to be defined.
...
- id: unique identifier (as reference to this table);
- tableStyle: a choice of tableStyle which can be influenced by using the corresponding classes in a cascading style sheet. Choices are tableStyle1 to tableStyle10;
- thresholdsCrossingsCounterHeaderText: String to be displayed in the table header;
- thresholdsCrossingsTableUpCrossingsHeaderText: not in use anymore: can be left blank.
- thresholdsCrossingsTableDownCrossingsHeaderText: not in use anymore: can be left blank.
- cellFormat: any string but "_thresholds" is recommended: style class of the table header in combination with the typeId (range always starts with a 0);
- topFormat; not in use anymore, can be left blank ;
- colWidth: width of a column in pixels;
- missingThresholdsText: Choice for missing threshold. Choices are: " ", "#", "" or " -";
- noThresholdsCrossed: definition of the null value (NAN) indicator. Choices are: " ", "-", "-999", " no data";
- countIndividualThresholds: true if individual threshold crossings must be counted; false (= default) if per location only the worst case must be counted
- thresholdTypes: array of thresholds, assuming a logical order
o typeId: textual indication of corresponding threshold level;
o name: indication of the text to appear in column headers;
Report section
A thresholdsCrossingsTable should be defined in the report as well. E.g. this table needs to be 'filled' with its corresponding timeseries.
...
Since this type of table is a table in which you can aggregate data (which means combine timeseries) the following option is available: mergeLocations.
thresholdCrossingCountsTable
A thresholdCrossingsCountsTable displays threshold crossing counts depending on which thresholds have been crossed within a given time period. The thresholdCrossingCountsTable is a new version of the thresholdsCrossingsTable. A thresholdCrossingCountsTable has the same layout as a thresholdCrossingCountsTab in the thresholdOverviewDisplay for consistency.
Declarations section
In the declaration sections the layout of the table needs to be defined in a thresholdCrossingCountsTableFormat.
...
- id: identifier of this table format.
- thresholdGroupId: id of a thresholdGroup that is defined in the thresholds configuration file. This table displays all thresholds in the specified thresholdGroup.
- relativePeriod: Relative time period for this table. The time period is relative to timeZero. A relative period can be e.g. -3 to +3 hours or e.g. +3 to +6 hours (relative to timeZero).
- countAllActiveThresholds: If true, then this table counts all thresholds that are active (all thresholds that have been crossed). If false, then for a given location this table only takes into account the active threshold with the most severe warning level. Default is false.
- countWarningAreas: If true, then this table counts warning areas, as follows. It is possible to define warning areas for a levelThresholdValue in the thresholdValueSets configuration file. If a crossed levelThresholdValue has warning areas defined, then the number of warning areas is counted for that levelThresholdValue. If a crossed levelThresholdValue has no warning areas defined, then a count of 1 is used for that levelThresholdValue. If this option is false, then for each crossed levelThresholdValue a count of 1 is used (i.e. the warning areas are ignored). Default is true.
- noThresholdsDefinedText: If specified, then this text is shown in cells that correspond to data for which no thresholds are defined. Default is empty space.
- noDataAvailableText: If specified, then this text is shown in cells for which no data is available. Default is "n/a".
- crossingCountZeroText: If specified, then this text is shown in cells for which there are no threshold crossings. Default is "-".
- tableHeaderText: String to be displayed in the table header. The relative period and thresholdGroup name will be appended to this string.
- columnWidth: The width of the columns in the table.
- tableStyle: The tableStyle to use for this table. The available tableStyles are defined in the report tables .css file.
- cellFormat: The cellFormat to use for this table. The available cellFormats for the configured tableStyle are defined in the report tables .css file.
- scrollableTable: Use this to split the table into two parts, one for the header row(s) and one for the data rows. The data row part refers to the tableStyle for this table with "_scrollable" appended. This can be used to make the data rows scrollable while the header row(s) remain fixed. For this to work the referred style needs to be defined in the report tables .css file.
Report section
In the reports section define a thresholdCrossingCountsTable.
...
- id: identifier for the template tag (in this case: $TABLE(table1)$);
- formatId: reference to the format of this table (to one of the thresholdCrossingCountsTableFormats in the declarations section);
- mergeLocations: boolean indicator. True means: treat all locations of mentioned timeseries together for combined assessment. False means: extract individual timeseries so that every row indicates one location (timeseries);
- Choice between
o timeSeries;
o table; --> this can be used to display a table within another one.
o tableRow
flagCountsTable
FlagCountsTable is available since Delft-FEWS release 2011.01. A FlagCountsTable displays flag counts depending on the flags of the values in a time series within a given time period.

Example of a flagCountsTable
Declarations section
In the declaration section the layout of the table needs to be defined in a flagCountsTableFormat.
...
| Code Block | ||||
|---|---|---|---|---|
| ||||
<flagCountsTableFormat id="flagCountsTableFormat"> <tableStyle>tableStyle1</tableStyle> <hyperlinkUrl>report.html#!LOCATION_NAME!_!PARAMETER_NAME!</hyperlinkUrl> </flagCountsTableFormat> |
Report section
In the reports section define a flagCountsTable.
...
| Code Block | ||||
|---|---|---|---|---|
| ||||
<flagCountsTable id="flagCountsTable" formatId="flagCountsTableFormat"> <inputVariableId>Cowbeech</inputVariableId> <inputVariableId>Romsey</inputVariableId> <inputVariableId>CrosslandsDrive</inputVariableId> </flagCountsTable> |
flagSourceCountsTable
FlagSourceCountsTable is available since Delft-FEWS release 2011.01. A FlagSourceCountsTable displays counts of flag sources depending on the flag sources of the values in a time series within a given time period. The flag source for a value contains the reason why that value got a certain flag. For example if a value was rejected by a "hard max" validation rule, then it gets flag unreliable and flag source "hard max".

Example of a flagSourceCountsTable
Declarations section
In the declaration section the layout of the table needs to be defined in a flagSourceCountsTableFormat.
...
| Code Block | ||||
|---|---|---|---|---|
| ||||
<flagSourceCountsTableFormat id="flagSourceCountsTableFormat"> <tableStyle>tableStyle1</tableStyle> </flagSourceCountsTableFormat> |
Report section
In the reports section define a flagSourceCountsTable.
...
| Code Block | ||||
|---|---|---|---|---|
| ||||
<flagSourceCountsTable id="flagSourceCountsTable1" formatId="flagSourceCountsTableFormat"> <inputVariableId>Cowbeech</inputVariableId> </flagSourceCountsTable> |
maximumStatusTable
A maximumStatusTable indicates, by colouring, when certain threshold levels are crossed. In this type of table, the rows should be defined individually and can contain more than one series. The boolean value 'mergLocation' plays an important role in combining the locations or treat them individually.

Figure 102 Example of a maximumStatusTable (NE Region)
Declarations section
In the declaration sections the layout of the table needs to be defined.
...
- tableStyle: a choice of tableStyle which can be influenced by using the corresponding classes in a cascading style sheet. Choices are tableStyle1 to tableStyle10;
- id: unique identifier (as reference to this table);
- mainHeaderText: a textual string which is displayed in the table header;
- timeStepsInTable: integer number of timesteps to be displayed in the table. This should be derived from the relativeViewPeriod of the corresponding timeSeries to add:
- timeStepsAggregation: integer number of timesteps to be aggregated (=taken together). Worst status is being displayed.
- timeHeaderInterval: integer number for aggregating the headers of the cells or not. Number '1' means 'no aggregation' so every column has got its own header.
- timeHeaderDisplayMinutes: boolean value for having the minutes displayed;
- colWidth: integer value for the width of the cells;
- showAsSingleColumn: boolean value for displaying the timeseries into one column only (true). If set to 'true' the last value of the timeseries is considered.
Reports Section
In the report itself the necessary timeseries needs to be assigned to the table.
...
| Info | ||
|---|---|---|
| ||
The maximumstatusTable was developed with the focus on the status of forecasted timeseries. When using the table to show the status in the past (eg to what extent timeseries are available), it is necessary to place the T0 in the past, at the beginning of the period to be displayed. This is contradictory to normal practice. |
Detailed Explanation: Two tables into one
In fact, the maximumStatusTable is designed as visualised below. To create a nicely aligned table the 'two timeseries tables' (the one with the 'observed' values and the one with the forecast series) are put in individual cells of the outer table. So the outer table only consist of two cells. The left cell contains the observed table, the right cell contains the forecast table. The outer table itself needs to be declared as well!! The report declaration (see above) can be inspected to see this one in practice.

Detailed Explanation: Wide variation of tables
The variation for displaying maximumStatus information is wide. The combination of relativeViewPeriod (length of forecast series), timestep and the desire to aggregate timesteps can all be implemented. The calculation should be correct. If not, several messages will be shown.
Some examples
Source: 12 hrs of 15min data
Display: maximumStatus with 15 minute data, time header by the hour (with minutes)
Configuration
...
For the two tables for which this is valid, the last example does not give much additional value for a thresholdsCrossingsTable. Then each row (which is equal to one locatation) will have a '1' in one of the cells. A maximumStatusTable supplies more value because it will indicate when this (maximum) threshold will be reached.
See below mentioned (simplified) figures.

mergedPrecipitationTable
A mergedPrecipitationTable contains both observed rainfall as well as forecast rainfall, preferably in P.merged timeseries. Data can be visualised in configurable time intervals compared to T0 and will appear in separate columns. Additionally, a single column can be added to visualise any parameter (e.g. CWI). An example can be found below (without extra column). In the example below, actually two tables are plotted next to each other. The left table (with names) contains the historical date. The one on the right hand side contains the forecast timeseries and has no name column. A table like this has two header rows to be defined by the user.

Figure 105 Example of a mergedPrecipitationTable (NE Region)
Declaration Section
In the declaration section the layout of the table needs to be defined.
...
- id: unique identifier (as reference to this table);
- tableStyle: a choice of tableStyle which can be influenced by using the corresponding classes in a cascading style sheet. Choices are tableStyle1 to tableStyle10;
- headerRow1Text: text to be displayed in table header (first line);
- headerRow2Text: text to be displayed in table header (second line);
- dataColumns: definition of individual column with a time interval for aggregating precipitation. Each column should contain:
- columnHeader: text to be displayed in column header (first line);
- unitHeader text to be displayed in column header (second line);
- relativeViewPeriod: period to aggregate the data;
- unit: unit to aggregate. Choices: day/hour/minute/second/week
- start: start of interval (in time unit) compared to T0;
- end: end of interval (in time unit) compared to T0;
- nameColumnWidth: integer value of width of the name column (most left column (if present));
- dataColumnWidth: integer value of width of the data columns;
- suppressNameColumn boolean value for setting the name column visible or not. This column, when visible, is filled with the (full) location name of the timeseries which is visualised in this table.
Report section
In the report section the content (timeseries) are 'attached' to this table.
...
- id: identifier (reference to the template tag)
- formatId: reference to the format of this table (to one of the mergedPrecipitationTables in the declarations section);
- table:
- id: identifier (used for comments only)
- formatId: reference to the format of this table (to one of the mergedPrecipitationTables in the declarations section)
- timeSeries: reference to an inputVariable.
SystemStatusTables
SystemStatusTables display information about the status and behaviour of the FEWS system itself (like in the System monitor).
...
| Info | ||
|---|---|---|
| ||
Notice that for the systemStatus reports the global variable "REPORTS_LEFTCOLMCID" should be included in the global properties. In case of a dual-MC, also "REPORTS_RIGHTCOLMCID" should be included. In a Stand-Alone, use REPORTS_LEFTCOLMCID=none |
liveSystemStatus liveSystemStatus
A liveSystemStatusTable displays information about the status and behaviour of the live system components (MasterController and Forecasting Shell Server(s))

Figure 109 Example of a liveSystemStatus table (NE Region)
Declarations Section

Figure 110 Example of the configuration of a liveSystemStatus table in the declarations section
...

Figure 112 Example of an exportStatus table (NE Region)
Declarations Section

Figure 113 Example of the configuration of an exportStatus table in the declarations section
...

Figure 115 Example of an importStatus table (NE Region)
Declarations Section

Figure 116 Example of the configuration of an importStatus table in the declarations section
...

Figure 118 Example of a scheduledworkflowStatus table (NE Region)
Declarations Section

Figure 119 Example of the configuration of a completedWorkflowStatus table in the declarations section
...

Figure 121 Example of a completedworkflowStatus table (NE Region)
Declarations Section

Figure 122 Example of the configuration of a completedWorkflowStatus table in the declarations section
...

Figure 124 Example of a currentForecastStatus table (NE Region)
Declarations Section

Figure 125 Example of the configuration of a currentForecast table in the declarations section
...

Figure 127 Example of a logMessageListing table (NE Region)
Declarations Section

Figure 128 Example of the configuration of a logMessageListing table in the declarations section
...

Figure 130 Example of a forecastHistory table (NE Region)
Declarations Section

Figure 131 Example of the configuration of a forecastHistory table in the declarations section
...
(keep in mind that "REPORTS_LEFTCOLMCID" should be included in the global properties (REPORTS_LEFTCOLMCID=none for Stand Alone)
AnimatedGIF
An animated GIF is an animation of a grid timeserie in a GIF image format. The advantage of this format is that it can easily be added to HTML pages, without the need to embed extra controls (like with AVI).
Reportsection

The following elements need to be defined:
...
To export a report see the reportExport module instance. However, if you simply want to include your created gif in a html report, you can use <IMG SRC="gif0_0.gif"> in the report template file, where gif0_0.gif refers to the name of your created gif.
Schematic Status Display Reports
Since 2013_01 it is possible to create reports of Schematic Status Display panels in the form of animations in the formats Avi and animated gif as well as snapshots in the form of Png files and Svg files.
For this purpose there will probably already be some Schematic Status Display configuration in the DisplayConfigFiles of the configuration. In order to create a report of a Schematic Status Display panel, most elements of this configuration can be copied manually to the reports configuration file. For configuring a Schematic Status Display panel please refer to Schematic Status Display configuration.
...
When first configuring a Schematic Status Display panel report, the scadaPanel section of the Schematic Status Display configuration can be copied directly to the Schematic Status Display Reports configuration. For Svg output the interactive sections will not be supported, so it is recommended to remove these.
Animation in Avi format
With this function an animation of the configured period can be generated for a single Schematic Status Display panel. Use id $SSD_AVI(myId)$ for including the avi file in the reports.
schematicStatusDisplayPanelAvi

| Code Block | ||||
|---|---|---|---|---|
| ||||
<schematicStatusDisplayPanelAvi id="ssdAvi"> <scadaPanel id="TK" name="Twentekanalen 10 min"> <svgFile>Twentekanalen.svg</svgFile> <nodeId>Twentekanalen Hydro</nodeId> ... </scadaPanel> <width>1024</width> <height>800</height> <relativePeriod unit="hour" start="-20" end="4"/> <timeStep unit="second" multiplier="300"/> <movieFrameDurationMillis>200</movieFrameDurationMillis> <fileName>SSD_test.avi</fileName> </schematicStatusDisplayPanelAvi> |
...
With this function an animation of the configured period can be generated for a single Schematic Status Display panel. Use id $SSD_ANIMATED_GIF(myId)$ for including the animated gif file in the reports.
schematicStatusDisplayPanelAnimatedGif
| Code Block | ||||
|---|---|---|---|---|
| ||||
<schematicStatusDisplayPanelAnimatedGif id="ssdGif"> <scadaPanel id="TK" name="Twentekanalen 10 min"> <svgFile>Twentekanalen.svg</svgFile> <nodeId>Twentekanalen Hydro</nodeId> ... </scadaPanel> <width>1024</width> <height>800</height> <relativePeriod unit="hour" start="-20" end="4"/> <timeStep unit="second" multiplier="300"/> <movieFrameDurationMillis>200</movieFrameDurationMillis> <fileName>SSD_test.gif</fileName> </schematicStatusDisplayPanelAnimatedGif> |
Snapshots in Png format
With this function one or more png images can be generated of a single Schematic Status Display panel. Use id $SSD_PNG(myId)$ for including the png files in the reports.
schematicStatusDisplayPanelSnapshotsPng
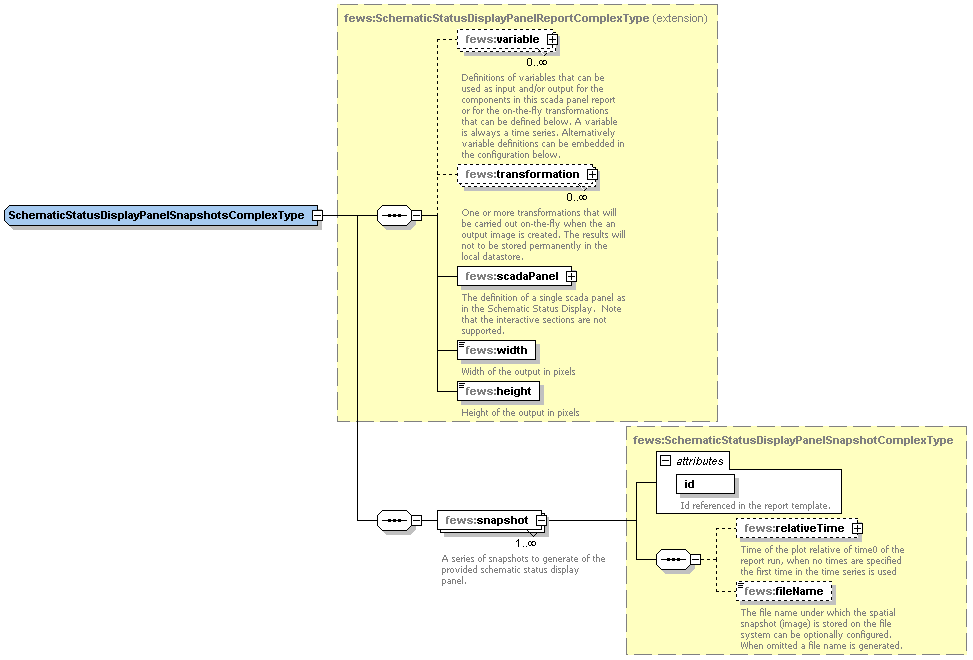
Sample demonstrating use of creating png snapshots that includes Schematic Status Display transformations:
| Code Block | ||||
|---|---|---|---|---|
| ||||
<schematicStatusDisplayPanelSnapshotsPng> <variable> ... </variable> <transformation id="UserSimpleTransformation"> <user> <simple> <expression>Waterstanden_10min * 100</expression> <outputVariable> <variableId>Waterstanden_10min_times_100</variableId> </outputVariable> </simple> </user> </transformation> <scadaPanel id="TK" name="Twentekanalen 10 min"> .... </scadaPanel > <width>1024</width> <height>800</height> <snapshot id="ssd1"> <relativeTime unit="hour" value="-4"/> <fileName>SSD_test1.png</fileName> </snapshot> <snapshot id="ssd2"> <relativeTime unit="hour" value="-3"/> <fileName>SSD_test2.png</fileName> </snapshot> </schematicStatusDisplayPanelSnapshotsPng> |
Snapshots in Svg format
With this function one or more svg images can be generated of a single Schematic Status Display panel. Use id $SSD_SVG(myId)$ for including the svg files in the reports.
The interactive parts of the Schematic Status Display such as Left Single Click Action and Left Double Click Action that can be configured when the Schematic Status Display is run in Delft-FEWS are not supported when exported as .svg report and it is recommended to remove these interactive sections where appropriate.
schematicStatusDisplayPanelSnapshotsSvg
| Code Block | ||||
|---|---|---|---|---|
| ||||
<schematicStatusDisplayPanelSnapshotsSvg> <scadaPanel id="TK" name="Twentekanalen 10 min"> .... </scadaPanel > <width>1024</width> <height>800</height> <snapshot id="ssd1"> <relativeTime unit="hour" value="-4"/> <fileName>SSD_test4.svg</fileName> </snapshot> <snapshot id="ssd2"> <relativeTime unit="hour" value="-3"/> <fileName>SSD_test5.svg</fileName> </snapshot> </schematicStatusDisplayPanelSnapshotsSvg> |
rowPerLocationHtmlTable
The rowPerLocationHtmlTable can be configured directly in <report> section, or in the <declarations> section and reffered from the <report> section. This table is a generic table type and contains for each configured location one row with several columns. The data displayed in a particular column are result of the function that is configured for that column.
...
- header : text to display in the column header,
- format: format to use for this column. It refers to the styles that are available in the html template file
- width: width of the column
- backgroundColorFunction: function to determine the background color of the cells in the column (see below)
- foregroundColorFunction: function to determine the foreground color of the cells in the column (see below)
- function: function that determines/computes the value displayed in the column (see below)
backgroundColorFunction and foregroundColorFunction
These elements currently support the following functions:
- THRESHOLDCROSSING(FIRST_THRESHOLDCOLOR; variableId)
- THRESHOLDCROSSING(MAX_THRESHOLDCOLOR; variableId)
- INDEXMAXWARNINGLEVELCOLOR(0; variableId)
function
The existing report functions, that are also used in html-templates, can be configured in the columns. For example MAXVALUE(variableId; numberFormat) or LASTVALUETIME(variableId; dateFormat).
...
- STATISTICS(statistical function; variableId; numberFormatId)
The argument 'statistical function' specifies which statistical function should be evaluated. Presently the following functions can be used: COUNT, KURTOSIS, MEAN, MEDIAN, MIN, MAX, RMSQ, RSQUARED, SKEWNESS, STANDARD_DEVIATION, SUM, VARIANCE
Example of the configuration in <report> section
...
| Code Block | ||
|---|---|---|
| ||
<report>

        <locationSetId>AllLocations</locationSetId>

        <rowPerLocationHtmlTable id="tableA" tableStyle="tableStyle3" >


	    <column>
		<header>Locatie id</header>
		<format>_data</format>
		<function>LOCATIONATTRIBUTE(id)</function>
	    </column>

           <column>
	  	<header>Locatie name</header>
	  	<format>_data</format>
		<width>200</width>
	  	<function>LOCATIONATTRIBUTE(name)</function>
	    </column>

            <column>
	 	<header>Eenheid</header>
	 	<format>_data</format>
	 	<function>PARAMETERATTRIBUTE(UNIT;Qobserved)</function>
	    </column>


             <column>
	    	<header>Datum 1e overschrijding</header>
	    	<format>_data</format>
	    	<function>THRESHOLDCROSSING(FIRST_DATE;Qobserved;dateFormatThreshold)</function>
	    </column>

            <column>
	    	<header>Tijdstip 1e overschrijding</header>
	    	<format>_data</format>
	    	<function>THRESHOLDCROSSING(FIRST_TIME;Qobserved;timeFormatThreshold)</function>
	    </column>

            <column>
		<header>Waarde 1e overschrijding</header>
		<format>_data</format>
		<function>THRESHOLDCROSSING(FIRST_VALUE;Qobserved;numberFormatThreshold)</function>
	    </column>


             <column>
	    	<header>Datum maximale overschrijding</header>
	    	<format>_data</format>
	    	<function>THRESHOLDCROSSING(MAX_DATE;Qobserved;dateFormatThreshold)</function>
	    </column>

             <column>
	    	<header>Tijdstip maximale overschrijding</header>
	    	<format>_data</format>
	    	<function>THRESHOLDCROSSING(MAX_TIME;Qobserved;timeFormatThreshold)</function>
	    </column>

 	   <column>
		<header>Waarde maximale overschrijding</header>
		<format>_data</format>
		<function>THRESHOLDCROSSING(MAX_VALUE;Qobserved;numberFormatThreshold)</function>
	    </column>


        </rowPerLocationHtmlTable>

        <template>ReportRowPerLocationTable.html</template>

        <outputFileName>tableA.html</outputFileName>
</report>
|
Example of the configuration in <declarations> section
...
| Code Block | ||
|---|---|---|
| ||
<declarations> <rowPerLocationHtmlTableFormat id="rowPerLocationFormat1" tableStyle="tableStyle3" > <column> <header>Naam</header> <format>_data_yellow</format> <function>LOCATIONATTRIBUTE(shortname)</function> </column> <column> <header>Tijd maximale overschrijding</header> <function>THRESHOLDCROSSING(MAX_DATETIME;Qobserved;dateFormat1)</function> </column> <column> <header>Waarde maximale overschrijding (m3/s)</header> <function>THRESHOLDCROSSING(MAX_VALUE;Qobserved;numberFormat1)</function> </column> <column> <header>Tijd maximale waterstand</header> <function>MAXTIME(Hobserved;dateFormat1)</function> </column> <column> <header>Maximale waterstand (m)</header> <function>MAXVALUE(Hobserved;numberFormat1)</function> </column> </rowPerLocationHtmlTableFormat> </declarations> |
...
Configuring the forecastThresholdCrossingXml report requires at least two input variables to be configured. One input variable containing the forecast ensemble time series for which the report must be generated, and a second input variable containing the a time series which has the current level (value) for the same locations. Optionally, additional forecast scenario input variables can be defined, each containing forecast time series (no ensemble) for the same locations as the ensemble input variable.
Example config
The example generated xml file was generated using the following configuration:
...