...
(keep in mind that "REPORTS_LEFTCOLMCID" should be included in the global properties (REPORTS_LEFTCOLMCID=none for Stand Alone)
AnimatedGIF
An animated GIF is an animation of a grid timeserie in a GIF image format. The advantage of this format is that it can easily be added to HTML pages, without the need to embed extra controls (like with AVI).
Reportsection

The following elements need to be defined:
- id: identifier to the template tag ($ANIMATED_GIF(GIFFILE.gif)$);
- name (optional, at this moment it is not possible to define the filename)
- timeSeriesSet: Definition of the timeserieset to be animated
- movieFrameDurationMillis: defines the speed of the animation
- barLegend: from 2012.02 it is possible to display a bar legend in the animation
- classBreaks: see Grid Display
- geomap: see Grid Display
- width: the width of the image in pixels
- height: the height of the image in pixels
To export a report see the reportExport module instance. However, if you simply want to include your created gif in a html report, you can use <IMG SRC="gif0_0.gif"> in the report template file, where gif0_0.gif refers to the name of your created gif.
Schematic Status Display Reports
Since 2013_01 it is possible to create reports of Schematic Status Display panels in the form of animations in the formats Avi and animated gif as well as snapshots in the form of Png files and Svg files.
For this purpose there will probably already be some Schematic Status Display configuration in the DisplayConfigFiles of the configuration. In order to create a report of a Schematic Status Display panel, most elements of this configuration can be copied manually to the reports configuration file. For configuring a Schematic Status Display panel please refer to Schematic Status Display configuration.
An example Schematic Status Display that contains the following configuration,
...
	<dateFormat id="DF1">
		<timeZone>
			<timeZoneName>CET</timeZoneName>
		</timeZone>
		<dateTimePattern>dd-MM-yyyy</dateTimePattern>
	</dateFormat>
	<numberFormat id="NF1">
		<pattern>{0,number,##0.00}</pattern>
	</numberFormat>
must be transferred to the report declarations. The definitions of the date format and number format cannot be copied directly to the report configuration since they have a slightly different format.
...
<reports xmlns="http://www.wldelft.nl/fews" xmlns:xsi="http://www.w3.org/2001/XMLSchema-instance" xsi:schemaLocation="http://www.wldelft.nl/fews http://fews.wldelft.nl/schemas/version1.0/reports.xsd" version="1.0">
<declarations>
	<defineGlobal id="ForecastingRegion">IWP-Twentekanalen</defineGlobal>
	<dateFormat id="DF1">
		<timeZone>
			<timeZoneName>CET</timeZoneName>
		</timeZone>
		<pattern>dd-MM-yyyy</pattern>
	</dateFormat>
	<numberFormat id="NF1">{0,number,##0.00}</numberFormat>
		...
</declarations>
<report>
...
// Add Ssd report elements here for generating Avi, Gif, Png or Svg.
...
</report>
</reports>
rowPerLocationHtmlTable
The rowPerLocationHtmlTable can be configured directly in <report> section, or in the <declarations> section and reffered from the <report> section. This table is a generic table type and contains for each configured location one row with several columns. The data displayed in a particular column are result of the function that is configured for that column.
For each column the following elements can be configured:
- header : text to display in the column header,
- format: format to use for this column. It refers to the styles that are available in the html template file
- width: width of the column
- backgroundColorFunction: function to determine the background color of the cells in the column (see below)
- foregroundColorFunction: function to determine the foreground color of the cells in the column (see below)
- function: function that determines/computes the value displayed in the column (see below)
backgroundColorFunction and foregroundColorFunction
These elements currently support the following functions:
- THRESHOLDCROSSING(FIRST_THRESHOLDCOLOR; variableId)
- THRESHOLDCROSSING(MAX_THRESHOLDCOLOR; variableId)
- INDEXMAXWARNINGLEVELCOLOR(0; variableId)
function
The existing report functions, that are also used in html-templates, can be configured in the columns. For example MAXVALUE(variableId; numberFormat) or LASTVALUETIME(variableId; dateFormat).
Furthermore the following functions are available:
- LOCATIONATTRIBUTE(attribute; <variableId>; <format>)
Argument attribute refers to the location attributes. The attributes differ per region.
The other arguments are optional. For example, use argument 'format' if the attribute is a number or a dateTime. VariableId can be omitted : (area;;numberFormat1)
There are 3 attributes with a fix name: id, name and shortname. These attribute refer always to the location id,name and short name as configured in the locations.xml.
The attributes are not case sensitive.
- PARAMETERATTRIBUTE(attribute; variableId; <format>)
Argument attribute refers to the parameter attributes. The attributes differ per region.
The argument format is optional. For example, use argument 'format' if the attribute is a number.
There are 4 attributes with a fix name: id, name,shortname and unit. These attributes refer always to the parameter id,name, short name and unit as configured in the parameters.xml.
The attributes are not case sensitive.
- THRESHOLDCROSSING(key;variableId;<format>); see note below!
The argument 'key' specifies which threshold crossing information should be given. Presently the following keys can be used:
FIRST_THRESHOLDNAME: name of the first level threshold that has been crossed
FIRST_VALUE: value of the first crossing
FIRST_DATETIME: date/time of the first crossing
FIRST_DATE: date of the first crossing
FIRST_TIME: time of the first crossing
MAX_THRESHOLDNAME: name of the highest level threshold that has been crossed
MAX_VALUE: value of the maximum crossing
MAX_DATETIME date/time of the maximum crossing
MAX_DATE: date of the maximum crossing
MAX_TIME: time of the maximum crossing
| Info |
|---|
Please note: If you configure any THRESHOLDCROSSING function in a column, then only the locations with threshold crossing will be printed by default. |
- STATISTICS(statistical function; variableId; numberFormatId)
The argument 'statistical function' specifies which statistical function should be evaluated. Presently the following functions can be used: COUNT, KURTOSIS, MEAN, MEDIAN, MIN, MAX, RMSQ, RSQUARED, SKEWNESS, STANDARD_DEVIATION, SUM, VARIANCE
Example of the configuration in <report> section
| Code Block | ||
|---|---|---|
| ||
<report>

        <locationSetId>AllLocations</locationSetId>

        <rowPerLocationHtmlTable id="tableA" tableStyle="tableStyle3" >


	    <column>
		<header>Locatie id</header>
		<format>_data</format>
		<function>LOCATIONATTRIBUTE(id)</function>
	    </column>

           <column>
	  	<header>Locatie name</header>
	  	<format>_data</format>
		<width>200</width>
	  	<function>LOCATIONATTRIBUTE(name)</function>
	    </column>

            <column>
	 	<header>Eenheid</header>
	 	<format>_data</format>
	 	<function>PARAMETERATTRIBUTE(UNIT;Qobserved)</function>
	    </column>


             <column>
	    	<header>Datum 1e overschrijding</header>
	    	<format>_data</format>
	    	<function>THRESHOLDCROSSING(FIRST_DATE;Qobserved;dateFormatThreshold)</function>
	    </column>

            <column>
	    	<header>Tijdstip 1e overschrijding</header>
	    	<format>_data</format>
	    	<function>THRESHOLDCROSSING(FIRST_TIME;Qobserved;timeFormatThreshold)</function>
	    </column>

            <column>
		<header>Waarde 1e overschrijding</header>
		<format>_data</format>
		<function>THRESHOLDCROSSING(FIRST_VALUE;Qobserved;numberFormatThreshold)</function>
	    </column>


             <column>
	    	<header>Datum maximale overschrijding</header>
	    	<format>_data</format>
	    	<function>THRESHOLDCROSSING(MAX_DATE;Qobserved;dateFormatThreshold)</function>
	    </column>

             <column>
	    	<header>Tijdstip maximale overschrijding</header>
	    	<format>_data</format>
	    	<function>THRESHOLDCROSSING(MAX_TIME;Qobserved;timeFormatThreshold)</function>
	    </column>

 	   <column>
		<header>Waarde maximale overschrijding</header>
		<format>_data</format>
		<function>THRESHOLDCROSSING(MAX_VALUE;Qobserved;numberFormatThreshold)</function>
	    </column>


        </rowPerLocationHtmlTable>

        <template>ReportRowPerLocationTable.html</template>

        <outputFileName>tableA.html</outputFileName>
</report>
|
Example of the configuration in <declarations> section
| Code Block | ||
|---|---|---|
| ||
<declarations>
	  <rowPerLocationHtmlTableFormat id="rowPerLocationFormat1" tableStyle="tableStyle3" >

  	   <column>
	  	<header>Naam</header>
	  	<format>_data_yellow</format>
		<function>LOCATIONATTRIBUTE(shortname)</function>
	    </column>

	       <column>
	    	<header>Tijd maximale overschrijding</header>
	    	<function>THRESHOLDCROSSING(MAX_DATETIME;Qobserved;dateFormat1)</function>
	     </column>


	       <column>
	    	<header>Waarde maximale overschrijding (m3/s)</header>
	    	<function>THRESHOLDCROSSING(MAX_VALUE;Qobserved;numberFormat1)</function>
	     </column>

	     <column>
	     	 <header>Tijd maximale waterstand</header>
	         <function>MAXTIME(Hobserved;dateFormat1)</function>
	     </column>

	     <column>
	     	 <header>Maximale waterstand (m)</header>
	         <function>MAXVALUE(Hobserved;numberFormat1)</function>
	     </column>

	  </rowPerLocationHtmlTableFormat>
</declarations>
|
forecastThresholdCrossingXml
The forecastThresholdCrossingXml report generates an xml-file containing threshold crossing information for a given ensemble time series. An example of a generated xml file can be found here.
Configuring the forecastThresholdCrossingXml report requires at least two input variables to be configured. One input variable containing the forecast ensemble time series for which the report must be generated, and a second input variable containing the a time series which has the current level (value) for the same locations. Optionally, additional forecast scenario input variables can be defined, each containing forecast time series (no ensemble) for the same locations as the ensemble input variable.
Example config
The example generated xml file was generated using the following configuration:
| Code Block | ||||
|---|---|---|---|---|
| ||||
<report>
   <inputVariable variableId="forecast_series">
      ...
   </inputVariable>
   <inputVariable variableId="ensemble_series">
      ...
   </inputVariable>
   <inputVariable variableId="level_series">
      ...
   </inputVariable>
   <forecastThresholdCrossingXml fileName="threshold-crossing.xml" locationNameAttribute="REPORT_NAME" externalLocationIdAttribute="EXTERNAL_ID">
      <forecastThresholdCrossingXmlTemplate>ForecastThresholdCrossing_template.xml</forecastThresholdCrossingXmlTemplate>
      <forecastEnsembleTimeSeries>ensemble_series</forecastEnsembleTimeSeries>
      <forecastScenarios>
         <forecastTimeSeries id="1" name="Forecast Policy" numberFormatId="numberFormatId">forecast_series</forecastTimeSeries>
      </forecastScenarios>
      <percentileScenarios>
         <percentile name="90% likely">90</percentile>
         <percentile name="75% likely">75</percentile>
      </percentileScenarios>
      <currentLevelTimeSeries numberFormatId="numberFormatId">level_series</currentLevelTimeSeries>
      <floodClasses>
         <default>less-than-minor</default>
         <floodClass thresholdId="levelThreshold1">minor</floodClass>
         <floodClass thresholdId="levelThreshold2">moderate</floodClass>
         <floodClass thresholdId="levelThreshold3">major</floodClass>
      </floodClasses>
      <additionalThresholds>
         <thresholdId>levelThreshold3</thresholdId>
         <thresholdId>levelThreshold4</thresholdId>
         <thresholdId>levelThreshold4</thresholdId>
      </additionalThresholds>
<siteFigures> |
When first configuring a Schematic Status Display panel report, the scadaPanel section of the Schematic Status Display configuration can be copied directly to the Schematic Status Display Reports configuration. For Svg output the interactive sections will not be supported, so it is recommended to remove these.
Animation in Avi format
With this function an animation of the configured period can be generated for a single Schematic Status Display panel. Use id $SSD_AVI(myId)$ for including the avi file in the reports.
schematicStatusDisplayPanelAvi

...
		<schematicStatusDisplayPanelAvi id="ssdAvi">
			<scadaPanel id="TK" name="Twentekanalen 10 min">
				<svgFile>Twentekanalen.svg</svgFile>
				<nodeId>Twentekanalen Hydro</nodeId>
				...
			</scadaPanel>
			<width>1024</width>
			<height>800</height>
			<relativePeriod unit="hour" start="-20" end="4"/>
			<timeStep unit="second" multiplier="300"/>
			<movieFrameDurationMillis>200</movieFrameDurationMillis>
			<fileName>SSD_test.avi</fileName>
		</schematicStatusDisplayPanelAvi>
Animation in animated Gif format
With this function an animation of the configured period can be generated for a single Schematic Status Display panel. Use id $SSD_ANIMATED_GIF(myId)$ for including the animated gif file in the reports.
schematicStatusDisplayPanelAnimatedGif
...
		<schematicStatusDisplayPanelAnimatedGif id="ssdGif">
			<scadaPanel id="TK" name="Twentekanalen 10 min">
				<svgFile>Twentekanalen.svg</svgFile>
				<nodeId>Twentekanalen Hydro</nodeId>
				...
			</scadaPanel>
			<width>1024</width>
			<height>800</height>
			<relativePeriod unit="hour" start="-20" end="4"/>
			<timeStep unit="second" multiplier="300"/>
			<movieFrameDurationMillis>200</movieFrameDurationMillis>
			<fileName>SSD_test.gif</fileName>
		</schematicStatusDisplayPanelAnimatedGif>
Snapshots in Png format
With this function one or more png images can be generated of a single Schematic Status Display panel. Use id $SSD_PNG(myId)$ for including the png files in the reports.
schematicStatusDisplayPanelSnapshotsPng
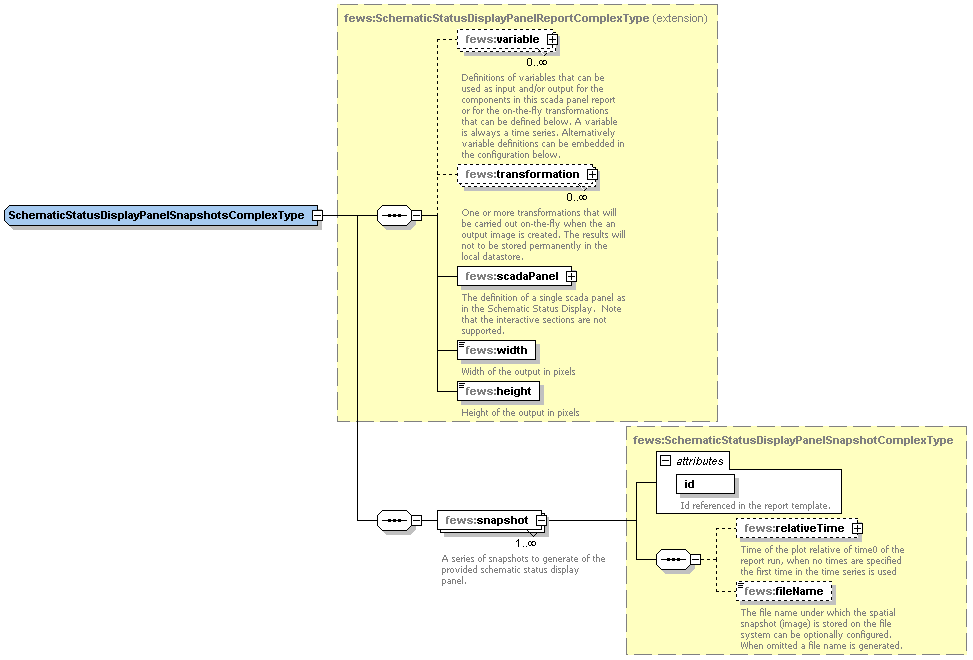
Sample demonstrating use of creating png snapshots that includes Schematic Status Display transformations:
...
	<schematicStatusDisplayPanelSnapshotsPng>
		<variable>
			...
		</variable>
		<transformation id="UserSimpleTransformation">
			<user>
				<simple>
					<expression>Waterstanden_10min * 100</expression>
					<outputVariable>
						<variableId>Waterstanden_10min_times_100</variableId>
					</outputVariable>
				</simple>
			</user>
		</transformation>

		<scadaPanel id="TK" name="Twentekanalen  10 min">
....
		</scadaPanel >
		<width>1024</width>
		<height>800</height>
		<snapshot id="ssd1">
			<relativeTime unit="hour" value="-4"/>
			<fileName>SSD_test1.png</fileName>
		</snapshot>
		<snapshot id="ssd2">
			<relativeTime unit="hour" value="-3"/>
			<fileName>SSD_test2.png</fileName>
		</snapshot>
	</schematicStatusDisplayPanelSnapshotsPng>
Snapshots in Svg format
With this function one or more svg images can be generated of a single Schematic Status Display panel. Use id $SSD_SVG(myId)$ for including the svg files in the reports.
The interactive parts of the Schematic Status Display such as Left Single Click Action and Left Double Click Action that can be configured when the Schematic Status Display is run in Delft-FEWS are not supported when exported as .svg report and it is recommended to remove these interactive sections where appropriate.
schematicStatusDisplayPanelSnapshotsSvg
...
	<schematicStatusDisplayPanelSnapshotsSvg>
		<scadaPanel id="TK" name="Twentekanalen  10 min">
....
		</scadaPanel >
		<width>1024</width>
		<height>800</height>
		<snapshot id="ssd1">
			<relativeTime unit="hour" value="-4"/>
			<fileName>SSD_test4.svg</fileName>
		</snapshot>
		<snapshot id="ssd2">
			<relativeTime unit="hour" value="-3"/>
			<fileName>SSD_test5.svg</fileName>
		</snapshot>
	</schematicStatusDisplayPanelSnapshotsSvg>
rowPerLocationHtmlTable
The rowPerLocationHtmlTable can be configured directly in <report> section, or in the <declarations> section and reffered from the <report> section. This table is a generic table type and contains for each configured location one row with several columns. The data displayed in a particular column are result of the function that is configured for that column.
For each column the following elements can be configured:
- header : text to display in the column header,
- format: format to use for this column. It refers to the styles that are available in the html template file
- width: width of the column
- backgroundColorFunction: function to determine the background color of the cells in the column (see below)
- foregroundColorFunction: function to determine the foreground color of the cells in the column (see below)
- function: function that determines/computes the value displayed in the column (see below)
backgroundColorFunction and foregroundColorFunction
These elements currently support the following functions:
- THRESHOLDCROSSING(FIRST_THRESHOLDCOLOR; variableId)
- THRESHOLDCROSSING(MAX_THRESHOLDCOLOR; variableId)
- INDEXMAXWARNINGLEVELCOLOR(0; variableId)
function
The existing report functions, that are also used in html-templates, can be configured in the columns. For example MAXVALUE(variableId; numberFormat) or LASTVALUETIME(variableId; dateFormat).
Furthermore the following functions are available:
- LOCATIONATTRIBUTE(attribute; <variableId>; <format>)
Argument attribute refers to the location attributes. The attributes differ per region.
The other arguments are optional. For example, use argument 'format' if the attribute is a number or a dateTime. VariableId can be omitted : (area;;numberFormat1)
There are 3 attributes with a fix name: id, name and shortname. These attribute refer always to the location id,name and short name as configured in the locations.xml.
The attributes are not case sensitive.
- PARAMETERATTRIBUTE(attribute; variableId; <format>)
Argument attribute refers to the parameter attributes. The attributes differ per region.
The argument format is optional. For example, use argument 'format' if the attribute is a number.
There are 4 attributes with a fix name: id, name,shortname and unit. These attributes refer always to the parameter id,name, short name and unit as configured in the parameters.xml.
The attributes are not case sensitive.
- THRESHOLDCROSSING(key;variableId;<format>); see note below!
The argument 'key' specifies which threshold crossing information should be given. Presently the following keys can be used:
FIRST_THRESHOLDNAME: name of the first level threshold that has been crossed
FIRST_VALUE: value of the first crossing
FIRST_DATETIME: date/time of the first crossing
FIRST_DATE: date of the first crossing
FIRST_TIME: time of the first crossing
MAX_THRESHOLDNAME: name of the highest level threshold that has been crossed
MAX_VALUE: value of the maximum crossing
MAX_DATETIME date/time of the maximum crossing
MAX_DATE: date of the maximum crossing
MAX_TIME: time of the maximum crossing
| Info |
|---|
Please note: If you configure any THRESHOLDCROSSING function in a column, then only the locations with threshold crossing will be printed by default. |
- STATISTICS(statistical function; variableId; numberFormatId)
The argument 'statistical function' specifies which statistical function should be evaluated. Presently the following functions can be used: COUNT, KURTOSIS, MEAN, MEDIAN, MIN, MAX, RMSQ, RSQUARED, SKEWNESS, STANDARD_DEVIATION, SUM, VARIANCE
Example of the configuration in <report> section
| Code Block | ||
|---|---|---|
| ||
<report> <locationSetId>AllLocations</locationSetId> <rowPerLocationHtmlTable id="tableA" tableStyle="tableStyle3" > <column> <header>Locatie id</header> <format>_data</format> <function>LOCATIONATTRIBUTE(id)</function> </column> <siteFigure> <column> <id>1</id> <header>Locatie name</header> <format>_data</format> <width>200</width> <function>LOCATIONATTRIBUTE(name)</function> <<name>@NAME@Forecast1</column>name> <fileName>@NAME@-forecast-1.png</fileName> <column> <header>Eenheid</header> <format>_data</format> <function>PARAMETERATTRIBUTE(UNIT;Qobserved)</function> </column> <type>png</type> <alternativeText>Graphical forecast for @NAME@</alternativeText> <viewPort left="0" top="0" width="800" height="600"/> </siteFigure> <column> <header>Datum 1e overschrijding</header> <siteFigure> <format>_data</format> <function>THRESHOLDCROSSING(FIRST_DATE;Qobserved;dateFormatThreshold)</function> <<id>2</column> id> <name>@NAME@Forecast2</name> <column> <fileName>@NAME@-forecast-2.png</fileName> <header>Tijdstip 1e overschrijding</header> <format>_data</format> <function>THRESHOLDCROSSING(FIRST_TIME;Qobserved;timeFormatThreshold)</function> <type>png</type> </column> <alternativeText>Graphical forecast for @NAME@</alternativeText> <viewPort <column> <header>Waarde 1e overschrijding</header> <format>_data</format> <function>THRESHOLDCROSSING(FIRST_VALUE;Qobserved;numberFormatThreshold)</function> </column> left="100" top="100" width="900" height="700"/> </siteFigure> </siteFigures> </forecastThresholdCrossingXml> <template>ForecastThresholdCrossing_template.xml</template> <!-- irrelevant, the report module will use the <forecastThresholdCrossingXmlTemplate> element to determine the <column> template --> <header>Datum maximale overschrijding</header> <outputSubDir>thresholdcrossing</outputSubDir> <format>_data</format> <function>THRESHOLDCROSSING(MAX_DATE;Qobserved;dateFormatThreshold)</function> </column> <column> <header>Tijdstip maximale overschrijding</header> <format>_data</format> <function>THRESHOLDCROSSING(MAX_TIME;Qobserved;timeFormatThreshold)</function> </column> <column> <header>Waarde maximale overschrijding</header> <format>_data</format> <function>THRESHOLDCROSSING(MAX_VALUE;Qobserved;numberFormatThreshold)</function> </column> </rowPerLocationHtmlTable> <template>ReportRowPerLocationTable.html</template> <outputFileName>tableA.html</outputFileName> </report> |
Example of the configuration in <declarations> section
| Code Block | ||
|---|---|---|
| ||
<declarations>
	  <rowPerLocationHtmlTableFormat id="rowPerLocationFormat1" tableStyle="tableStyle3" >

  	   <column>
	  	<header>Naam</header>
	  	<format>_data_yellow</format>
		<function>LOCATIONATTRIBUTE(shortname)</function>
	    </column>

	       <column>
	    	<header>Tijd maximale overschrijding</header>
	    	<function>THRESHOLDCROSSING(MAX_DATETIME;Qobserved;dateFormat1)</function>
	     </column>


	       <column>
	    	<header>Waarde maximale overschrijding (m3/s)</header>
	    	<function>THRESHOLDCROSSING(MAX_VALUE;Qobserved;numberFormat1)</function>
	     </column>

	     <column>
	     	 <header>Tijd maximale waterstand</header>
	         <function>MAXTIME(Hobserved;dateFormat1)</function>
	     </column>

	     <column>
	     	 <header>Maximale waterstand (m)</header>
	         <function>MAXVALUE(Hobserved;numberFormat1)</function>
	     </column>

	  </rowPerLocationHtmlTableFormat>
</declarations>
|
forecastThresholdCrossingXml
The forecastThresholdCrossingXml report generates an xml-file containing threshold crossing information for a given ensemble time series. An example of a generated xml file can be found here.
Configuring the forecastThresholdCrossingXml report requires at least two input variables to be configured. One input variable containing the forecast ensemble time series for which the report must be generated, and a second input variable containing the a time series which has the current level (value) for the same locations. Optionally, additional forecast scenario input variables can be defined, each containing forecast time series (no ensemble) for the same locations as the ensemble input variable.
Example config
The example generated xml file was generated using the following configuration:
| Code Block | ||||
|---|---|---|---|---|
| ||||
<report>
   <inputVariable variableId="forecast_series">
      ...
   </inputVariable>
   <inputVariable variableId="ensemble_series">
      ...
   </inputVariable>
   <inputVariable variableId="level_series">
      ...
   </inputVariable>
   <forecastThresholdCrossingXml fileName="threshold-crossing.xml" locationNameAttribute="REPORT_NAME" externalLocationIdAttribute="EXTERNAL_ID">
      <forecastThresholdCrossingXmlTemplate>ForecastThresholdCrossing_template.xml</forecastThresholdCrossingXmlTemplate>
      <forecastEnsembleTimeSeries>ensemble_series</forecastEnsembleTimeSeries>
      <forecastScenarios>
         <forecastTimeSeries id="1" name="Forecast Policy" numberFormatId="numberFormatId">forecast_series</forecastTimeSeries>
      </forecastScenarios>
      <percentileScenarios>
         <percentile name="90% likely">90</percentile>
         <percentile name="75% likely">75</percentile>
      </percentileScenarios>
      <currentLevelTimeSeries numberFormatId="numberFormatId">level_series</currentLevelTimeSeries>
      <floodClasses>
         <default>less-than-minor</default>
         <floodClass thresholdId="levelThreshold1">minor</floodClass>
         <floodClass thresholdId="levelThreshold2">moderate</floodClass>
         <floodClass thresholdId="levelThreshold3">major</floodClass>
      </floodClasses>
      <additionalThresholds>
         <thresholdId>levelThreshold3</thresholdId>
         <thresholdId>levelThreshold4</thresholdId>
         <thresholdId>levelThreshold4</thresholdId>
      </additionalThresholds>
      <siteFigures>
         <siteFigure>
            <id>1</id>
            <name>@NAME@Forecast1</name>
            <fileName>@NAME@-forecast-1.png</fileName>
            <type>png</type>
            <alternativeText>Graphical forecast for @NAME@</alternativeText>
            <viewPort left="0" top="0" width="800" height="600"/>
         </siteFigure>
         <siteFigure>
            <id>2</id>
            <name>@NAME@Forecast2</name>
            <fileName>@NAME@-forecast-2.png</fileName>
            <type>png</type>
            <alternativeText>Graphical forecast for @NAME@</alternativeText>
            <viewPort left="100" top="100" width="900" height="700"/>
         </siteFigure>
      </siteFigures>
   </forecastThresholdCrossingXml>
   <template>ForecastThresholdCrossing_template.xml</template> <!-- irrelevant, the report module will use the <forecastThresholdCrossingXmlTemplate> element to determine the template -->
   <outputSubDir>thresholdcrossing</outputSubDir>
   <outputFileName>crossingTest.html</outputFileName> <!-- irrelevant, the report module will use the "filename" attribute of the <forecastThresholdCrossingXml> element to determine the output file name -->
</report> |
The ForecastThresholdCrossing_template.xml can contain normal report tags which will be replaced as usual. This report type also allows several report specific tags:
- %GENERATION_TIME% : The system time at the moment the report is generated.
- %FORECAST_START_TIME% : the t0 with which the report is generated.
- %NEXT_GENERATION_TIME% : if the workflow in which the report is generated is a scheduled task, the next time at which this task will run is reported. Otherwise: "N/A".
- %PREVIOUS_GENERATION_TIME% : if the workflow in which the report is generated has been run before, the last time at which the workflow was run is reported. Otherwise: "N/A"
- %ENSEMBLE% : this tag will be replaced with the <ensemble> element and all of its sub-elements as described below.
The forecastThresholdCrossingXml report type generates an <ensemble> element for the given ensemble input time series. This ensemble element will first contain a number of <scenario> elements equal to the number of forecast scenario time series specified in the configuration. The id and name attributes of each of these <scenario> elements will match the configured id and name for the <forecastTimeSeries> in the configuration. After the <scenario> elements, there will be a <sites> element in which for each location in the given ensemble time series, the current level (taken from the level time series), figures (determined using the <siteFigures> in the configuration) and threshold crossings for each of the scenarios (both the configured forecast and percentile scenarios) will be reported. The thresholds which are to be included in the report are all the thresholds named in the <floodClasses> element as well as the thresholds configured in the <additionalThresholds> element.
With each value reported for the forecast scenario time series as well as the level time series, the report will also contain a "flood-class". This flood class is determined using the <floodClasses> configured. The flood class corresponding to a value is the highest of the configured flood class thresholds which is exceeded by the value, or the configured default flood class if none of the thresholds is exceeded.
For each of the configured <percentileScenarios> a percentile time series will be calculated. For example for a percentile of 90, FEWS will calculate the (100 - 90) = 10th percentile value for the ensemble time series for each time step (the value for which 90% of ensembles have a higher value) to obtain a "90% likely" time series. The generated report file will then include whether this calculated percentile time series exceeded each of the thresholds and if so, the earliest exceedance time step.
floodScenarioXml
...
| Jira | ||||||
|---|---|---|---|---|---|---|
|
...
<outputFileName>crossingTest.html</outputFileName> <!-- irrelevant, the report module will use the "filename" attribute of the <forecastThresholdCrossingXml> element to determine the output file name -->
</report> |
The ForecastThresholdCrossing_template.xml can contain normal report tags which will be replaced as usual. This report type also allows several report specific tags:
- %GENERATION_TIME% : The system time at the moment the report is generated.
- %FORECAST_START_TIME% : the t0 with which the report is generated.
- %NEXT_GENERATION_TIME% : if the workflow in which the report is generated is a scheduled task, the next time at which this task will run is reported. Otherwise: "N/A".
- %PREVIOUS_GENERATION_TIME% : if the workflow in which the report is generated has been run before, the last time at which the workflow was run is reported. Otherwise: "N/A"
- %ENSEMBLE% : this tag will be replaced with the <ensemble> element and all of its sub-elements as described below.
The forecastThresholdCrossingXml report type generates an <ensemble> element for the given ensemble input time series. This ensemble element will first contain a number of <scenario> elements equal to the number of forecast scenario time series specified in the configuration. The id and name attributes of each of these <scenario> elements will match the configured id and name for the <forecastTimeSeries> in the configuration. After the <scenario> elements, there will be a <sites> element in which for each location in the given ensemble time series, the current level (taken from the level time series), figures (determined using the <siteFigures> in the configuration) and threshold crossings for each of the scenarios (both the configured forecast and percentile scenarios) will be reported. The thresholds which are to be included in the report are all the thresholds named in the <floodClasses> element as well as the thresholds configured in the <additionalThresholds> element.
With each value reported for the forecast scenario time series as well as the level time series, the report will also contain a "flood-class". This flood class is determined using the <floodClasses> configured. The flood class corresponding to a value is the highest of the configured flood class thresholds which is exceeded by the value, or the configured default flood class if none of the thresholds is exceeded.
For each of the configured <percentileScenarios> a percentile time series will be calculated. For example for a percentile of 90, FEWS will calculate the (100 - 90) = 10th percentile value for the ensemble time series for each time step (the value for which 90% of ensembles have a higher value) to obtain a "90% likely" time series. The generated report file will then include whether this calculated percentile time series exceeded each of the thresholds and if so, the earliest exceedance time step.
floodScenarioXml
WORK-IN-PROGRESS (TO DO RUDIE:
| Jira | ||||||
|---|---|---|---|---|---|---|
|
AnimatedGIF
An animated GIF is an animation of a grid timeserie in a GIF image format. The advantage of this format is that it can easily be added to HTML pages, without the need to embed extra controls (like with AVI).
Reportsection
The following elements need to be defined:
- id: identifier to the template tag ($ANIMATED_GIF(GIFFILE.gif)$);
- name (optional, at this moment it is not possible to define the filename)
- timeSeriesSet: Definition of the timeserieset to be animated
- movieFrameDurationMillis: defines the speed of the animation
- barLegend: from 2012.02 it is possible to display a bar legend in the animation
- classBreaks: see Grid Display
- geomap: see Grid Display
- width: the width of the image in pixels
- height: the height of the image in pixels
To export a report see the reportExport module instance. However, if you simply want to include your created gif in a html report, you can use <IMG SRC="gif0_0.gif"> in the report template file, where gif0_0.gif refers to the name of your created gif.
Schematic Status Display Reports
Since 2013_01 it is possible to create reports of Schematic Status Display panels in the form of animations in the formats Avi and animated gif as well as snapshots in the form of Png files and Svg files.
For this purpose there will probably already be some Schematic Status Display configuration in the DisplayConfigFiles of the configuration. In order to create a report of a Schematic Status Display panel, most elements of this configuration can be copied manually to the reports configuration file. For configuring a Schematic Status Display panel please refer to Schematic Status Display configuration.
An example Schematic Status Display that contains the following configuration,
| Code Block | ||||
|---|---|---|---|---|
| ||||
	<dateFormat id="DF1">
		<timeZone>
			<timeZoneName>CET</timeZoneName>
		</timeZone>
		<dateTimePattern>dd-MM-yyyy</dateTimePattern>
	</dateFormat>
	<numberFormat id="NF1">
		<pattern>{0,number,##0.00}</pattern>
	</numberFormat>
|
must be transferred to the report declarations. The definitions of the date format and number format cannot be copied directly to the report configuration since they have a slightly different format.
| Code Block | ||||
|---|---|---|---|---|
| ||||
<reports xmlns="http://www.wldelft.nl/fews" xmlns:xsi="http://www.w3.org/2001/XMLSchema-instance" xsi:schemaLocation="http://www.wldelft.nl/fews http://fews.wldelft.nl/schemas/version1.0/reports.xsd" version="1.0">
<declarations>
	<defineGlobal id="ForecastingRegion">IWP-Twentekanalen</defineGlobal>
	<dateFormat id="DF1">
		<timeZone>
			<timeZoneName>CET</timeZoneName>
		</timeZone>
		<pattern>dd-MM-yyyy</pattern>
	</dateFormat>
	<numberFormat id="NF1">{0,number,##0.00}</numberFormat>
		...
</declarations>
<report>
...
// Add Ssd report elements here for generating Avi, Gif, Png or Svg.
...
</report>
</reports>
|
When first configuring a Schematic Status Display panel report, the scadaPanel section of the Schematic Status Display configuration can be copied directly to the Schematic Status Display Reports configuration. For Svg output the interactive sections will not be supported, so it is recommended to remove these.
Animation in Avi format
With this function an animation of the configured period can be generated for a single Schematic Status Display panel. Use id $SSD_AVI(myId)$ for including the avi file in the reports.
schematicStatusDisplayPanelAvi
| Code Block | ||||
|---|---|---|---|---|
| ||||
		<schematicStatusDisplayPanelAvi id="ssdAvi">
			<scadaPanel id="TK" name="Twentekanalen 10 min">
				<svgFile>Twentekanalen.svg</svgFile>
				<nodeId>Twentekanalen Hydro</nodeId>
				...
			</scadaPanel>
			<width>1024</width>
			<height>800</height>
			<relativePeriod unit="hour" start="-20" end="4"/>
			<timeStep unit="second" multiplier="300"/>
			<movieFrameDurationMillis>200</movieFrameDurationMillis>
			<fileName>SSD_test.avi</fileName>
		</schematicStatusDisplayPanelAvi>
|
Animation in animated Gif format
With this function an animation of the configured period can be generated for a single Schematic Status Display panel. Use id $SSD_ANIMATED_GIF(myId)$ for including the animated gif file in the reports.
schematicStatusDisplayPanelAnimatedGif
| Code Block | ||||
|---|---|---|---|---|
| ||||
		<schematicStatusDisplayPanelAnimatedGif id="ssdGif">
			<scadaPanel id="TK" name="Twentekanalen 10 min">
				<svgFile>Twentekanalen.svg</svgFile>
				<nodeId>Twentekanalen Hydro</nodeId>
				...
			</scadaPanel>
			<width>1024</width>
			<height>800</height>
			<relativePeriod unit="hour" start="-20" end="4"/>
			<timeStep unit="second" multiplier="300"/>
			<movieFrameDurationMillis>200</movieFrameDurationMillis>
			<fileName>SSD_test.gif</fileName>
		</schematicStatusDisplayPanelAnimatedGif>
|
Snapshots in Png format
With this function one or more png images can be generated of a single Schematic Status Display panel. Use id $SSD_PNG(myId)$ for including the png files in the reports.
schematicStatusDisplayPanelSnapshotsPng
Sample demonstrating use of creating png snapshots that includes Schematic Status Display transformations:
| Code Block | ||||
|---|---|---|---|---|
| ||||
	<schematicStatusDisplayPanelSnapshotsPng>
		<variable>
			...
		</variable>
		<transformation id="UserSimpleTransformation">
			<user>
				<simple>
					<expression>Waterstanden_10min * 100</expression>
					<outputVariable>
						<variableId>Waterstanden_10min_times_100</variableId>
					</outputVariable>
				</simple>
			</user>
		</transformation>

		<scadaPanel id="TK" name="Twentekanalen  10 min">
....
		</scadaPanel >
		<width>1024</width>
		<height>800</height>
		<snapshot id="ssd1">
			<relativeTime unit="hour" value="-4"/>
			<fileName>SSD_test1.png</fileName>
		</snapshot>
		<snapshot id="ssd2">
			<relativeTime unit="hour" value="-3"/>
			<fileName>SSD_test2.png</fileName>
		</snapshot>
	</schematicStatusDisplayPanelSnapshotsPng>
|
Snapshots in Svg format
With this function one or more svg images can be generated of a single Schematic Status Display panel. Use id $SSD_SVG(myId)$ for including the svg files in the reports.
The interactive parts of the Schematic Status Display such as Left Single Click Action and Left Double Click Action that can be configured when the Schematic Status Display is run in Delft-FEWS are not supported when exported as .svg report and it is recommended to remove these interactive sections where appropriate.
schematicStatusDisplayPanelSnapshotsSvg
| Code Block | ||||
|---|---|---|---|---|
| ||||
	<schematicStatusDisplayPanelSnapshotsSvg>
		<scadaPanel id="TK" name="Twentekanalen  10 min">
....
		</scadaPanel >
		<width>1024</width>
		<height>800</height>
		<snapshot id="ssd1">
			<relativeTime unit="hour" value="-4"/>
			<fileName>SSD_test4.svg</fileName>
		</snapshot>
		<snapshot id="ssd2">
			<relativeTime unit="hour" value="-3"/>
			<fileName>SSD_test5.svg</fileName>
		</snapshot>
	</schematicStatusDisplayPanelSnapshotsSvg>
|