...
Creating Spatial Modifiers
...
In 2019.02
...
the first spatial modifiers were added. These modifiers are used to modify a grid time series and must be created through the Spatial Display instead of the Modifiers Panel.
Spatial Modifier Mode
To create spatial modifiers, the spatial modifier mode must be activated. To do so, first select the grid plot containing the time series you wish to modify, and then activate spatial modifier mode through the ![]() button. To indicate which grid plot is currently being modified, i.e., the grid plot which was selected when modifier mode was activated, a wrench icon will appear in the tree and the tool-tip of the modifier mode button will show the name of the grid plot.
button. To indicate which grid plot is currently being modified, i.e., the grid plot which was selected when modifier mode was activated, a wrench icon will appear in the tree and the tool-tip of the modifier mode button will show the name of the grid plot.
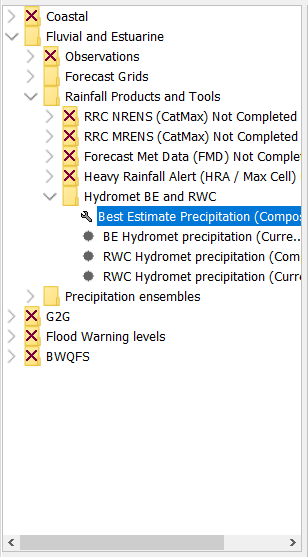

It is only possible to create spatial modifiers for the grid plot on which spatial modifier mode was activated. If you wish to change which plot you are modifying, spatial modifier mode must be deactivated (by clicking the ![]() button) and reactivated on the new grid plot.
button) and reactivated on the new grid plot.
When spatial modifier mode is activated, the spatial modifier button section will appear in the toolbar. This contains the following buttons.
Button | Description |
|---|---|
| Start time. Select the current time as new modifier start time. |
| End time. Select the current time as new modifier end time. |
| Clear period. Clear the selected new modifier period. |
| Copy modifier. Used when creating spatial copy modifiers. |
| Paste modifier. Used when creating spatial copy modifiers. |
| Spatial profile. Used to create a spatial profile modifier. |
When spatial modifier mode is activated the colors on the time slider will indicate the time periods on which modifiers are applied and the selected period for new modifiers (if any). The new modifier period will be shown in green. The color for the time steps on which a spatial modifier is active can be configured. In this example the configured color is black. It is also possible to configure ticks for the start and end time of the period of applied modifiers and start and end time of the selected new modifier period.

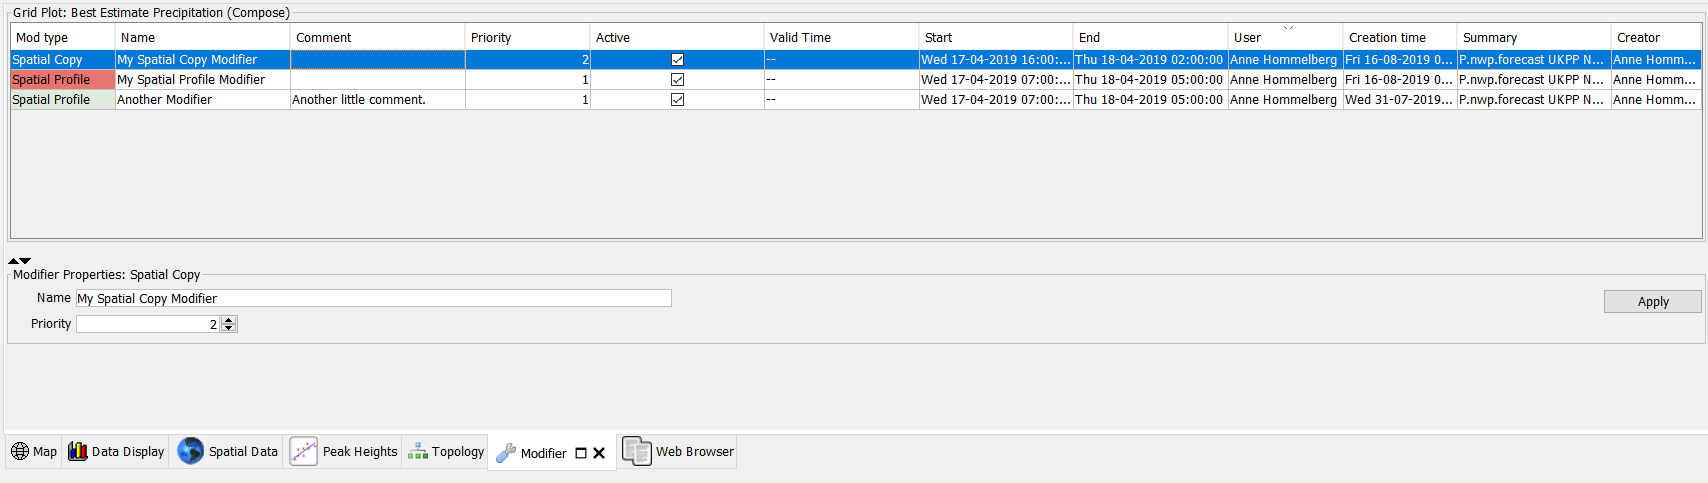
When spatial modifier mode is activated, the Modifiers Panel will show the modifiers for the grid plot being modified, instead of showing the modifiers for the selected forecast tree node. This is indicated by the title appearing directly above the table in the modifiers panel. When spatial modifier mode is deactivated, the modifiers panel will return to showing the modifiers for the selected forecast tree node.
When spatial modifier mode is activated, this is done "globally". This means that on any other spatial displays, spatial modifier mode will be active as well and for the same grid plot.
General Steps
This section explains the general steps necessary to create any spatial modifier. For any spatial modifier, the area on which the modifier is to be applied must be drawn and the time period for which the modifier should be applied must be selected. These steps can be done in any order.
Sketching the spatial modifier area
The area(s) on which a spatial modifier should be applied should be sketched using the sketch functionality of the spatial display. You can start drawing an area by selecting the "Draw Area" tool in the sketch button drop-down menu and left-clicking the map. Alternatively, you can hold the shift-key on the keyboard while left-clicking the map. Once you have started an area, left-clicking will result in a new point being added to the area border. Double clicking will finish the drawing by adding the double clicked point and closing the drawn polygon. Additional areas can then be drawn in a similar fashion. The drawn areas can be removed by using the "Delete Sketch" option in the sketch button drop-down menu or pressing the "Delete" key on the keyboard.
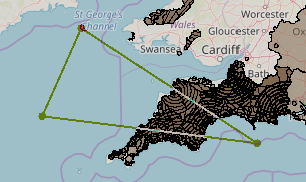
The current sketched areas will appear on the map with solid lines and point markers on each of the sketched border points:
Selecting the new modifier period
Each spatial modifier needs to be created for a certain time period. This period is set by selecting the start and end time of the period. Once a valid period has been selected, it will be marked green on the time slider. The selected start and end time will be marked with ticks if this has been configured.
To select the new modifier period, first select the time step you wish to use as the start or end time. Then the ![]() and
and ![]() buttons can be used to select the current time step as the new modifier period start or end time respectively. Alternatively, the time slider has been given a right-click menu which also contains these options:
buttons can be used to select the current time step as the new modifier period start or end time respectively. Alternatively, the time slider has been given a right-click menu which also contains these options:

The selected new modifier period can be cleared through the ![]() button or the "Clear the selected new modifier period" option in the right-click menu of the time slider.
button or the "Clear the selected new modifier period" option in the right-click menu of the time slider.
Note that all options to select a new modifier period are only available when spatial modifier mode is active. If spatial modifier mode is deactivated, the new modifier period is cleared.
Creating a Spatial Copy Modifier
A spatial copy modifier takes the values of a different grid time series for a certain area and time period, and copies these values over the existing values in the modified time series. To create a spatial copy modifier, spatial modifier mode must be activated and an area and time period must be selected as explained in the sections above.
Select the grid plot you wish to copy the values from and use the ![]() button to copy a "potential spatial copy modifier" to the clipboard. When the
button to copy a "potential spatial copy modifier" to the clipboard. When the ![]() button is clicked, the Spatial Display will take the area sketch, new modifier period and grid plot selected at the time the button is clicked and use this in the new "potential spatial copy modifier".
button is clicked, the Spatial Display will take the area sketch, new modifier period and grid plot selected at the time the button is clicked and use this in the new "potential spatial copy modifier".
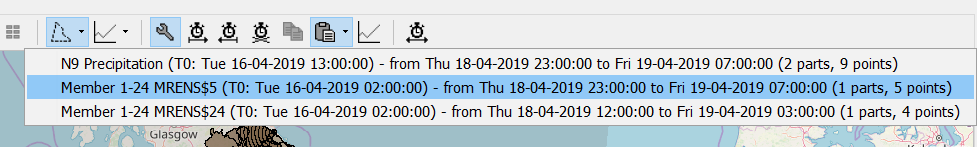
To actually create a spatial copy modifier the "potential spatial copy modifier" needs to be pasted into the grid plot being modified. To do so, select this grid plot and then click the ![]() button to paste the most recently copied information. The drop down menu of the
button to paste the most recently copied information. The drop down menu of the ![]() button shows information on the most recent copy actions (up to five). Selecting one of the menu items in the drop down menu will paste that "potential spatial copy modifier".
button shows information on the most recent copy actions (up to five). Selecting one of the menu items in the drop down menu will paste that "potential spatial copy modifier".
It is possible to open two spatial displays side-by-side to be able to view the grid plot being modified as well as the time series you wish to use to copy values from. Note that to do so, the sketch and time period to be used should be selected in the same spatial display as you will use to select the time series you will copy values from and click the ![]() button.
button.
When the paste button (or one of the drop-down menu items) is clicked, the spatial modifier creation dialog will be shown to set the general modifier properties and confirm the creation of the new modifier. The contents of this dialog are explained below.
Creating a Spatial Profile Modifier
TODO: write section
Spatial Modifier Creation Dialog
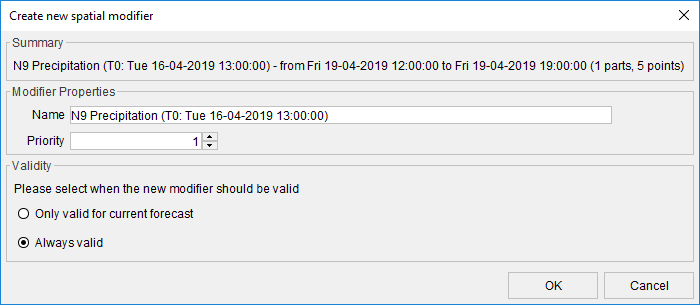
When a spatial modifier is created, for example when the paste button is clicked to create a spatial copy modifier, the spatial modifier creation dialog is shown. This dialog allows the user to set the modifier properties like it's name and priority, and select the valid time they wish to use.
Modifier Properties
The modifier properties shown and set in the spatial modifier creation dialog are the same as the modifier properties that would be set through the modifiers panel for non-spatial modifiers. This includes the name, any user-defined description fields and the modifier priority. These properties can later be edited through the modifiers panel by selecting the modifier you wish to edit in the table.
Name
The name of the modifier. This field will be automatically filled with a summary of the modifier as a suggestion. It can contain at most 64 characters.
User Defined Description Fields
These can be configured in the modifier types. In the example shown above, there is one user defined description field configured called "Comment". These description fields can be used to allow users to add some additional information on the modifier they created.
Priority
The priority controls the order in which spatial modifiers are applied. This can be relevant if spatial modifiers have areas that overlap. For example, you may wish to create a spatial modifier for a large area, then modify a smaller subarea in a different way with a second spatial modifier. Modifiers are applied from the one with the highest value for priority to the one with the lowest value (so a modifier with priority 1 will be applied after a modifier with priority 2). This causes the modifier with the lowest value to be "on top". By default the priority is set to 1. In the previous example, you should set the priority of the modifier for the large area to a higher number, so the spatial modifier for the smaller area will appear on top (with default priority of 1). When two spatial modifiers have the same priority, there is no guarantee they will be applied in a certain order.
Validity
The validity options allow setting the forecast(s) a spatial modifier should be applied to. There are two options:
- Only valid for current forecast. If this option is selected, the newly created modifier will only be applied to the current forecast. Its valid time will be set to the forecast time of the current forecast.
- Always valid. If this option is selected, the newly created modifier will be applied to all forecasts (for the same time series). Its valid time will be left blank. This means the modifier will also be applied to previous forecasts and any new forecasts. Note that if the time period of the modifier falls outside the time period of a forecast, naturally applying the modifier will have no effect.
Viewing Existing Spatial Modifiers
TODO: write section
Setting the display time
The display time in the spatial display can be changed in the standalone system only . The use is similar to the setting the display time in the data display, but with less modification possibilities.
When the display time is modified, the relative start and end times of the data to be shown are reset and the time slider is adjusted accordingly.
...