...
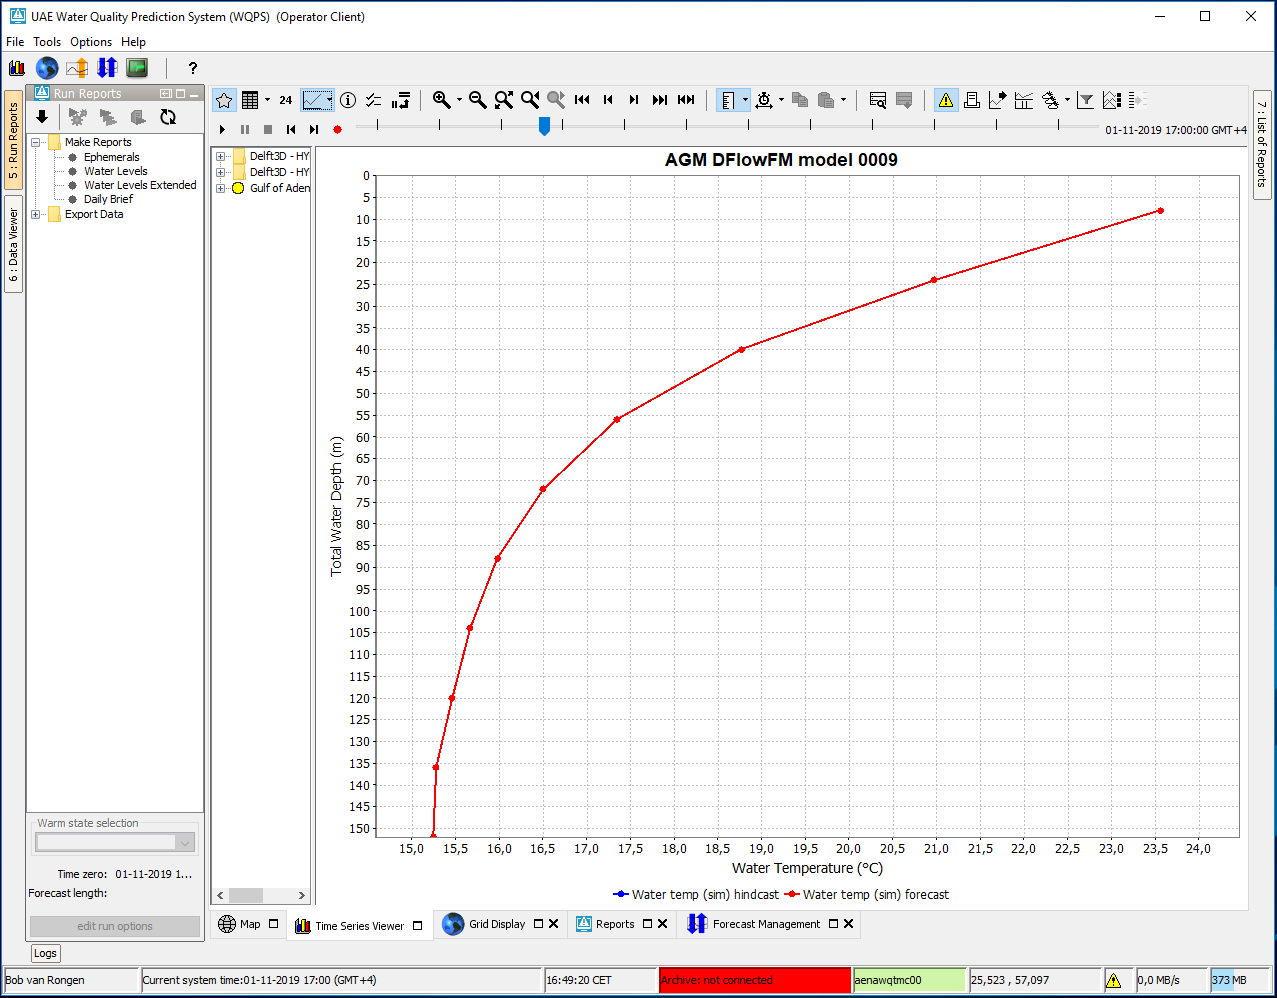
When the spatial display is showing 3D (layered) data, a vertical profile can be extracted. A point should be drawn as described in the previous section, then select the 'Show Vertical Profile' option by right clicking or press Ctrl+F4 to show a time series dialog with the vertical profile for the drawn point. Alternatively a 'Show Vertical Profile For Coordinates...' option is available by right clicking or by pressing Ctrl+F5. The vertical profile will be shown as a line graph of the parameter versus the water depth. One can also create a vertcial profile with a color map by selecting the 'Use Color Map' option in the drop-down menu of the ![]() button or using Ctrl-M. The vertical profile will then be shown as a graph of water depth over time with the colors in the plot indicating the values of the selected parameter.
button or using Ctrl-M. The vertical profile will then be shown as a graph of water depth over time with the colors in the plot indicating the values of the selected parameter.
Extracting longitudinal profiles (Xsections) from a grid time series
...