...
In the gridDisplay.xml for each gridPlot one or more classBreakId's can be referenced. For example:
| Code Block | ||||
|---|---|---|---|---|
| ||||
<gridPlot id="kzn_temperature" name="Temperature">
   <dataLayer>
      <timeSeriesSet>
         <moduleInstanceId>kzn</moduleInstanceId>
         <valueType>grid</valueType>
         <parameterId>water_temperature</parameterId>
         <locationId>SigmaLayer_0</locationId>
         <timeSeriesType>external historical</timeSeriesType>
         <timeStep unit="nonequidistant"/>
         <readWriteMode>read complete forecast</readWriteMode>
      </timeSeriesSet>
      <sigmaScaleReferenceTimeSeriesSet>
         <moduleInstanceId>kzn</moduleInstanceId>
         <valueType>grid</valueType>
         <parameterId>water_depth</parameterId>
         <locationId>kzn</locationId>
         <timeSeriesType>external historical</timeSeriesType>
         <timeStep unit="nonequidistant"/>
         <readWriteMode>read complete forecast</readWriteMode>
      </sigmaScaleReferenceTimeSeriesSet>
   </dataLayer>
   <hideLastValueCheckBox>true</hideLastValueCheckBox>
   <classBreaksId>Class.Temperature</classBreaksId>
   <classBreaksId>Class.Temperature.Extreme</classBreaksId>
</gridPlot> |
...
- layers (required): the layerId of the plot to display. Only one layerid is supported.
- time (required): the time for which the grid has to be plotted. Only one time is supported. Time ranges are NOT supported. Time has to be in the xml dateformat: yyyy-MM-ddTHH:mm:ssZ. The times returned by the GetCapabilities are in this format as well.
- width (optional): width of the image. Default is 800.
- height (optional): height of the image. Default is 600
- version (optional): supported version is 1.3 and is the default if not set. Older versions might work, but are not supported
- crs (required): the output projection of the plot. Only supported projection is: EPSG:3857
- bbox (required): the bounding box (in the projection as defined by the SRS parameter) of the extent that should be plot.
- colorscalerange (optional, since 2020.02): rescale the colors in the map by changing the min and max values of the range. The minimuma value and maximum value are seperated by a , For example: colorscalerange=2.0,10.0. This option can be used for legends as well.
- styles (optional, since 2020.02 ): a style can be passed as request parameter by passing the styles parameter. N.B. only one style can currently be passed to the GetMap request. For example: styles=Class.Temperature.Extreme. Available styles are reported by GetCapabilities per layer.
Vendor request parameters
...
GetLegendGraphic
Get the legend as an image as in png or in json format for a specified gridPlotId.
...
- layers (required): the gridPlotId of the gridPlot which legend should be displayed. Only one gridPlotId is supported.
- width (optional): width of the legend. Default is 150.
- height (optional): height of the image. The default is based on the number of legend items, 15 pixels per item.
- colorscalerange (optional, since 2020.02): rescale the colors in the map by changing the min and max values of the range. The minimuma value and maximum value are seperated by a , For example: colorscalerange=2.0,10.0. This option can parametercan be used for the GetMap as well.
- styles style (optional, since 2020.02 ): a style can be passed as request parameter. For example: style=Class.Temperature.Extreme. A style is the id of an existing class break that has been configured in the TimeSeriesDisplayConfig.xmlAvailable styles are reported by the GetCapabilities request per layer.
Vendor request parameters
- format (optional, since 2020.02): The format of the GetLegendGraphic response. Possible values are: image/png (the default) or application/json.
Response
Transparent PNG image of the requested legend graphics for the specified gridPlotId and size.
Example request:
| Code Block |
|---|
http://localhost:8181/FewsWebServices/wms?SERVICE=WMS&REQUEST=GetLegendGraphic&LAYERS=Precipitation%20GPM%20%5Bmm%5D&WIDTH=150&HEIGHT=400 |
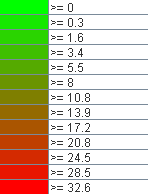
Example png response
The following example requests a legend in json format and applies a style as well.
| Code Block |
|---|
http://localhost:8181/FewsWebServices/wms?SERVICE=WMS&request=GetLegendGraphic&layers=kzn_temperature&format=application/json&style=Class.Temperature.Extreme |
The json response is as follows:
| Code Block |
|---|
{
  "legend" : [ {
    "lowerValue" : 15.0,
    "color" : "#042333"
  }, {
    "lowerValue" : 27.1,
    "color" : "#3c0912"
  }, {
    "lowerValue" : 39.3,
    "color" : "#730e27"
  }, {
    "lowerValue" : 51.4,
    "color" : "#a62225"
  }, {
    "lowerValue" : 63.6,
    "color" : "#c0583b"
  }, {
    "lowerValue" : 75.7,
    "color" : "#d08b73"
  }, {
    "lowerValue" : 87.9,
    "color" : "#dfbcb0"
  }, {
    "lowerValue" : 100.0,
    "color" : "#f1edec"
  } ]
} |
Properties
The following WMS specific properties can be configured in the FewsPiService.properties file. For more information on properties, see: FEWS Web Services configuration FewsPiService.properties
...