...
Transparent PNG image of the requested gridPlot for the specified timeStep, size and extent.
Example request
| Code Block |
|---|
http://localhost:8080/FewsWebServices/wms?service=WMS&request=GetMap&version=1.3&layers=Temp_forecast_nwp&crs=EPSG%3A3857&time=2018-09-01T00%3A00%3A00.000Z&width=920&height=500&bbox=-1261269.140637805,4786137.922323937,1921144.283455659,6515710.435418212 |
Example png response:

Example request for a specific forecast using externalForecastTime and layers
| Code Block |
|---|
http://localhost:8080/FewsWebServices/wms?request=GetMap&version=1.3&externalForecastTime=2019-07-01T00:00:00Z&layers=france_gfs_T_forecasts&crs=EPSG%3A3857&time=2019-07-01T12:00:00Z&width=920&height=500&bbox=-1416930.666816287,5052492.089340451,1765482.757277179,6782064.602434729 |
Example request for a specific forecast using a layer name with external forecast time embedded in the layer name.
| Code Block |
|---|
http://localhost:8080/FewsWebServices/wms?request=GetMap&version=1.3&layers=france_gfs_T_forecasts-2019-06-24T00:00:00Z&crs=EPSG%3A3857&time=2019-07-01T12:00:00Z&width=920&height=500&bbox=-1416930.666816287,5052492.089340451,1765482.757277179,6782064.602434729 |
Example request for a specific forecast and ensemble member:
| Code Block |
|---|
http://localhost:8080/FewsWebServices/wms?service=WMS&request=GetMap&version=1.3&layers=CS3-ens-2020-04-12T18%3A00%3A00Z&styles=&format=image%2Fpng&transparent=true&crs=EPSG%3A3857&showContours=false&importFromExternalDataSource=false&ensembleId=MOSurge&ensembleMemberId=2&time=2020-04-16T23%3A00%3A00.000Z&uppercase=false&width=920&height=600&bbox=-1787059.1846184619,6194009.947982673,1395354.2394750044,8269496.963695805 |
Example request for a specific forecast and ensemble member using the dim_ensemble_member parameter:
| Code Block |
|---|
http://localhost:8080/FewsWebServices/wms?service=WMS&request=GetMap&version=1.3&layers=CS3-ens-2020-04-12T18%3A00%3A00Z&styles=&format=image%2Fpng&transparent=true&crs=EPSG%3A3857&showContours=false&importFromExternalDataSource=false&dim_ensemble_member=MOSurge_2&time=2020-04-16T23%3A00%3A00.000Z&uppercase=false&width=920&height=600&bbox=-1787059.1846184619,6194009.947982673,1395354.2394750044,8269496.963695805 |
Using the WMS Test page an extra dropdown list will appear below the Selected layer. In this example layer CS3-ens is an ensemble grid. The ensembleId is "MOSurge". When selected, the list of ensemble member id's will be populated next to it which allows you to select a specific ensemble member on the test page. When right clicking on a specific grid cell, the timeseries can be requested for a specific grid cell for the selected layer, external forecast time, ensemble and time step.
GetLegendGraphic
Get the legend as an image in png or in json format for a specified gridPlotId.
Request parameters
Example request using a style
| Code Block |
|---|
http://localhost:8080/FewsWebServices/wms?service=WMS&request=GetMap&version=1.3&layers=kzn_z_salinity&format=image%2Fpng&transparent=true&crs=EPSG%3A3857&showContours=false&styles=Class.Salinity&time=2010-04-15T19%3A00%3A00.000Z&uppercase=false&width=920&height=600&bbox=3142222.4777002227,-3789947.3838540292,3937825.8337235893,-3271075.6299257413 |
Example request using a colorscalerange
| Code Block |
|---|
http://localhost:8080/FewsWebServices/wms?service=WMS&request=GetMap&version=1.3&layers=kzn_z_salinity&format=image%2Fpng&transparent=true&crs=EPSG%3A3857&showContours=false&colorscalerange=2.0,10.0&time=2010-04-15T19%3A00%3A00.000Z&uppercase=false&width=920&height=600&bbox=3142222.4777002227,-3789947.3838540292,3937825.8337235893,-3271075.6299257413 |
GetLegendGraphic
Get the legend as an image in png or in json format for a specified gridPlotId.
Request parameters
- layers (required): the gridPlotId of the gridPlot which legend should be displayed. Only one gridPlotId is supported.
- width (optional): width of the legend. Default is 150.
- height (optional): height of the image. The default is based on the number of legend items, 15 pixels per item.
- colorscalerange (optional, since 2020.
- layers (required): the gridPlotId of the gridPlot which legend should be displayed. Only one gridPlotId is supported.
- width (optional): width of the legend. Default is 150.
- height (optional): height of the image. The default is based on the number of legend items, 15 pixels per item.
- colorscalerange (optional, since 2020.02): rescale the colors in the map by changing the min and max values of the range. The minimuma value and maximum value are seperated by a , For example: colorscalerange=2.0,10.0. This parametercan be used for the GetMap as well.
- style (optional, since 2020.02 ): a style can be passed as request parameter. For example: style=Class.Temperature.Extreme. Available styles are reported by the GetCapabilities request per layer.
...
| Code Block |
|---|
{
  "legend" : [ {
    "lowerValue" : 30.0,
    "color" : "#042333"
  }, {
    "lowerValue" : 32.9,
    "color" : "#3c0912"
  }, {
    "lowerValue" : 35.7,
    "color" : "#730e27"
  }, {
    "lowerValue" : 38.6,
    "color" : "#a62225"
  }, {
    "lowerValue" : 41.4,
    "color" : "#c0583b"
  }, {
    "lowerValue" : 44.3,
    "color" : "#d08b73"
  }, {
    "lowerValue" : 47.1,
    "color" : "#dfbcb0"
  }, {
    "lowerValue" : 50.0,
    "color" : "#f1edec"
  } ]
} |
WMS Test Page
Most functionality of the WMS service can be tested using the WMS service test page.
General usage
On the top left there are buttons to zoom in, zoom out and enter full screen mode.
On the bottom is the time navigator that will be populated with all available times for the currently selected layer. Using the time navigator you can step back and foreward in time, start or stop animations, enable autorepeat and select the number of frames per second (fps) that should be used during animation.
Layer and forecast selection
All available layers reported by the GetCapabilities will be available in a dropdown list. For some layers it is also possible to search for older forecasts. They are not reported by default by the GetCapabilites but requires an explicit search. This can be done by specifiying a forecast period and selecting how many forecast should be searched for during that period. When clicking the play button next to the forecast period, all available forecast times will be available in the drop down list next to the selected layer. To display a specific forecast, the forecast time can be selected from the drop down list.
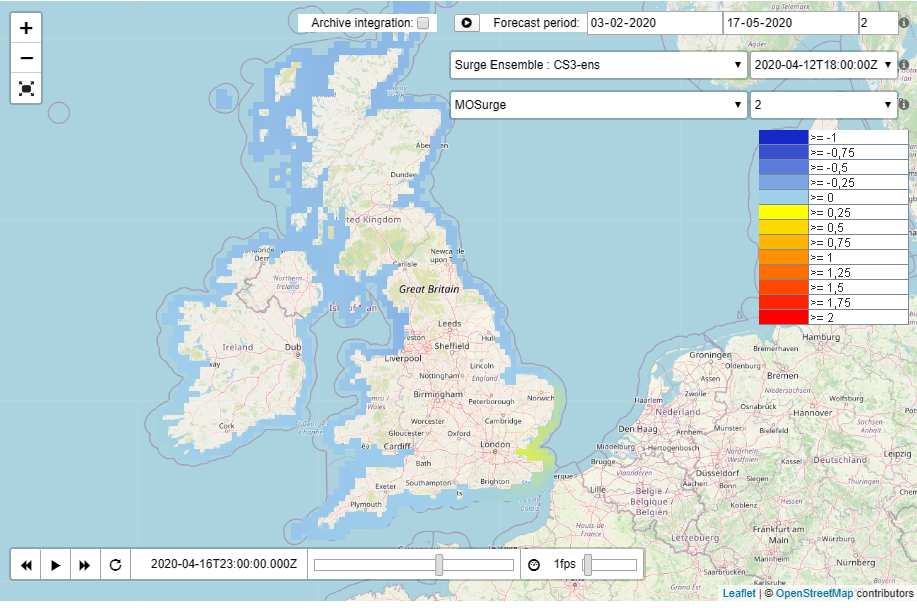
Ensembles
Using the WMS Test page an extra dropdown list will appear below the Selected layer. In this example layer CS3-ens is an ensemble grid. The ensembleId is "MOSurge". When selected, the list of ensemble member id's will be populated next to it which allows you to select a specific ensemble member on the test page. When right clicking on a specific grid cell, the timeseries can be requested for a specific grid cell for the selected layer, external forecast time, ensemble and time step.
Styles and rescale colors
Elevation
Properties
The following WMS specific properties can be configured in the FewsPiService.properties file. For more information on properties, see: FEWS Web Services configuration FewsPiService.properties
...