In the Time series dialog window it is possible to change the look and feel of the displayed timeseries. By pressing the right mouse button, in the chart area of the display, a list will appear containing the option Properties... (see figure 1).
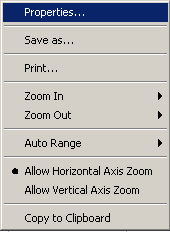
Selecting the Properties... menu item will make the Chart Properties editor appear (see figure 2).figure 1: Right mouse pop up menu of the chart display
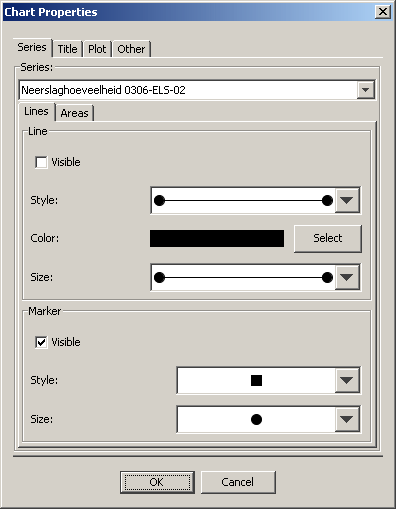
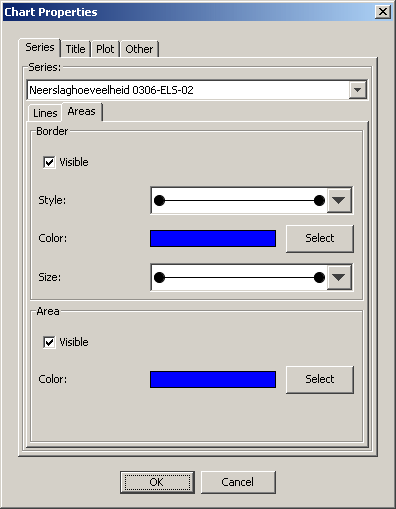
figure 2: Chart Properties editor; left - Lines tab, right - Areas tab
Using the Series tab is possible to alter the display properties of the timeseries arrays. To change the properties of an array select the series descriptor in the drop down box at the top of the panel. Then select either the Lines tab or the Area tab depending if the selected series is line or a bar.
Lines tab
The lines tab allows the user to change the properties of lines and line markers.
- Line - visible: toggles visibility of line
- Line - style: change the line style
- Line - color: change the line color
- Line - size: change the line width
- Marker - visible: toggles visibility of line markers
- Marker - style: change the marker shape
- Marker - size: change size of marker
Areas tab
The areas tab allows the user to change the properties of areas such as bars and markers
- Border - visible: toggles visibility of area border
- Border - color: change the border color
- Border - size: change the border width
- Area - visible: toggle the visibility of the fill color
- Area - color: change the area fill color
Code Block Note! These changes are not persistent and only remain in affect until the next update of the chart. This does give the user enough time to save the altered display as an image.