...
FEWS Explorer
...
...
Overview
...
FEWS Explorer is the principal window of Delft FEWS. The main elements of FEWS Explorer are highlighted in the figure below.
 1.2
1.2
1.3 h5.
Map display
The map display serves a double purpose. The first is to give an overview of the available locations given a combination of filters applied and to allow the user to select or deselect locations by clicking the location icon. The second is to provide a geographical background to the locations involved in the flood forecast. 1.4
1.5 h5.
Filters
The list boxes- also called filters- are required to identify the data to be displayed in a graph or table, or the icons on the map. There are four list boxes, from top to bottom:
- Time series groups
- Locations
- Data types (parameters)
- Forecasts
1.6 1.7 h5.
Drop down menus
The drop down menu bar provides access to all displays configured for your configuration of FEWS.
...
Button bar
The Tool bar provides quick access to frequently used tools. Tools are plug-ins to FEWS Explorer
...
.
...
...
Log Panel
The Log Viewer relays high level messages generated by active system components. Additionally, detailed messages are available in the Log Browser.
...
Status Bar
The Status Bar provides information about the status of the forecasting system
...
.
...
...
Map Display
...
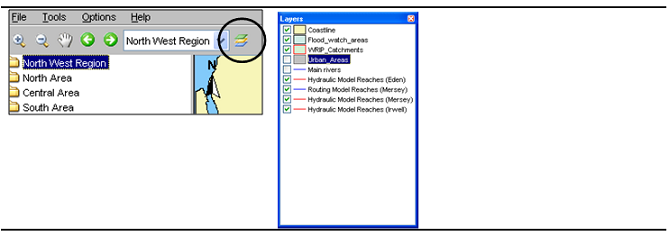
Locations are displayed on top of the background map. The selected main filter determines which locations will be displayed. The background map may be configured to consist of stacked layering of various maps. For each map details about line types and fill colours may be set as well. Map layers can be disabled via the Layers button on the Button Bar..
1.15
1.16 h5. ** 1.17 h5.
Map navigation
Map navigation options are set in the zoom toolbar item. After clicking the '+' button you can manually zoom in to a user defined map area. With the '-' button you can zoom out. Panning is possible after having clicked the hand button. Returning and moving forward between previously selected zoom extents can be done after clicking the arrow buttons. The drop-down allows you to select pre-defined zoom ranges.
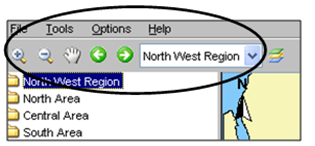
Please note that in case you want to leave the zoom or pan mode, you have to click the buttons again.
Zooming with scroll wheel
Alternatively, zooming can be done with help of the scroll wheel on the mouse (when available). Zooming in and out is done by respectively turning the scroll wheel away and towards for the user. The position of the cursor determines the centre point of the zoom action.
Selecting locations
| Wiki Markup |
|---|
| Wiki Markup |
  !image006.png!
Please note that in case you want to leave the zoom or pan mode, you have to click the buttons again.
1.18 \\
1.19 h5. *Zooming with scroll wheel*
Alternatively, zooming can be done with help of the scroll wheel on the mouse (when available). Zooming in and out is done by respectively turning the scroll wheel away and towards for the user. The position of the cursor determines the centre point of the zoom action.
1.20 \\
1.21 h5. *Selecting locations*
Point and click the icon. The icon of the selected location will modify to show it has been selected. Multiple locations can be selected by holding down the \[*CTRL* \] key while selecting. Locations can also be selected in the list boxes. |
...
An example is given below;
 1.22
1.22 Anchor
Filters
...
The filters are the 4 list boxes at the left hand side of the FEWS Explorer. The filters are used to select the data to be displayed in a graph or table. Your selection can be filtered by making one of more choices in the list boxes.
Selection of location types
Anchor
| Wiki Markup |
|---|
To select a list of multiple locations, hold down the \[*SHIFT* \] key between the first and second selection. Hold down the \[*CTRL* \] key to select multiple location types individually.
* |
Locations
...
list
...
box
* The locations associated with the selected main filter(s) are shown in the locations filter. Selected location will be highlighted on the map by means of a blue square. Locations can also be selected in the map display.
Location related icons are displayed on the map as well as in front of the location names.
Different icons are used to display locations and give information about the availability of data and about the hydrological status of the locations. More information about location related icons is given below in a separate section.
Data types list box
The data types associated with the selected main filter(s) are shown in the data types list box.
...
When depending on the selections made no data is available for a particular location or parameter its name is greyed out.
Forecast list box
The forecast list box displays forecasts that have been selected for viewing with help of the Forecast Manager. By highlighting one or more forecasts in this filter you can display them in graphs and tables.
...
The selection of forecasts in the Forecast list box can be removed by clicking the right mouse button with the cursor placed in the forecast list box. A pop-up menu appears with 'Remove all'. Pressing this menu item will remove the list of forecasts from the list box. Please note that this will just remove the selection but will not remove the actual forecasts from the database.
1.23 Anchor
Location related icons
...
Locations related icons can refer to the following types of information:
- Location type icons
- Data availability icons (validation information)
- Hydrological status icons (threshold information)
Location type
For different types of locations different icons can be configured to allow for easier identification. Please note that only a single location type icon can be defined per location. In case for example various data types are available at a certain location that relate to different icons, the choice has to be made which icon will be displayed.
In Delft FEWS the following location icons have been chosen but in principle any icon could be chosen to represent a location type in FEWS.
|
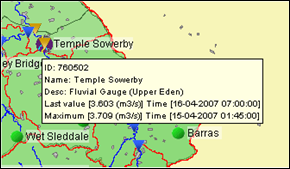
| gauged fluvial site ** |
| | ungauged fluvial site |
| | meteorological site |
| | radar data site |
| | coastal site |
| | catchment centre point |
| | default site |


Data availability
In case all data is missing in the configured view period, a red cross will be displayed on top of the location icon. The configured view period equals the length of historic run for observed data and the length of the forecast run for forecast data.
|
| no data available in view period ** |
| | example of fluvial site with missing data |


Hydrological and meteorological status
In case the high flow thresholds or rainfall thresholds are exceeded somewhere in the configured view period, the following icon is displayed.
|
| a threshold exceeded in view period ** |

The threshold status icons are only displayed for the current forecast or selected forecast and observed data.
...
There are 5 extra icons pre-configured for 5 threshold levels that are merged with the original threshold icon. These extra icons are:
|
| Level 1 threshold crossing in historic and forecast period ** |
| | Level 2 threshold crossing in historic and forecast period |
| | Level 3 threshold crossing in historic and forecast period |
| | Level 4 threshold crossing in historic and forecast period |
| | Level 5 threshold crossing in historic and forecast period |


For a level 3 threshold crossing in the historic period the combined threshold icon for a location will look as follows:
 . 1.24
 Anchor
Log Viewer
...
The Log Viewer provides information about the status of tasks run by the system. The messages that are displayed by the Log Viewer- called System Messages- are meant for both end users and system managers. Typical system logs are the successful start and finish of a module run.
The following type of system messages are identified:
Log level ** | Description |
Fatal | Severe errors that cause premature termination |
Error | Other runtime errors or unexpected conditions |
Warn | Events that are undesirable or unexpected, but not necessarily wrong |
Info | Runtime events (startup/shutdown) that allows tracking of the progress of the system |
...
Per message, the Log Viewer provides the following information:
...
- Clear Messages will remove all messages from the panel
- Save As will allow you to save the messages in the Log Panel to file
1.25Anchor _Toc62267721 _Toc62267721 Anchor _Toc140564162 _Toc140564162Anchor _Toc172823834 _Toc172823834 **
Status Bar
...
The Status Bar provides information about the status of the forecasting system. The information that is displayed can be defined by the user via the Options menu (see also Options ). Some information is always visible.
The following information can be displayed: 1.26
1.27 h5.
Operator name (always displayed)
The name of the operator that has logged in is displayed.1.28
1.29 h5.
Current system time
The current system time is the time in which the system 'lives'. The current system time moves forward in the so-called "Cardinal Time Step". In the live system the current system time will generally be the same as the current time. For analysis purposes, the system time can be set back in the standalone system to simulate a particular situation in the past.
...
In case however, the same analysis is done without setting back the system , all data until the current time will be available for the analysis. This means that in this case also the above mentioned missing import data will be used in the analysis.
1.30 1.31 h5.
FEWS time
This is the time that is configured in FEWS to display information. 1.32
1.33 h5.
Local time
The actual computer time. This is the time the user configures in the regional settings of windows. 1.34
1.35 h5.
Time of last refresh (only relevant for OC)
The time of last refresh indicates the last time the local data store has been synchronised with the Central Database. Not relevant for Stand alone FEWS configurations. 1.36
1.37 h5.
System status
The system status indicates in what mode the system is currently operating: online, or stand-alone.
...
- In case the colour is green, the OC is logged on and fully synchronised with the MC displayed in system status box:
 1.38
1.38
1.39 h5.
Mouse co-ordinates
Mouse co-ordinates displayed in the configured co-ordinate system
1.40 1.41 h5.
System status icon (always displayed)
The System status icon- in the lower right corner of the display- indicates whether the system operates normally or that severe errors are encountered. The icon has the following display modes:
_Green __  ___
___
System is running normally but warnings have been encountered.
_Yellow __  ___
___
System encountered severe errors in the past 48 hours. This means that at least one system message has been generated with log level ERROR. After all messages with this log level have been acknowledged by the user via the System Monitor (see also System Monitor ), the icon becomes green again.
_Red __  ___
___
System encountered fatal errors in the past 48 hours. This means that at least one system message has been generated with log level FATAL. After all messages with this log level have been acknowledged by the user via the System Monitor (see also System Monitor ), the icon becomes green again.
1.42