...
| Wiki Markup |
|---|
When the display is started through the FEWS Tools menu item _Data Editor_ , data can be edited and the edited data can be stored in the FEWS data base. When the display is started through the FEWS Tools menu item _Data Display_ or through the FEWS toolbar, the data can only be viewed. 1.1 <ac:structured-macro ac:name="anchor" ac:schema-version="1" ac:macro-id="d25dac94f50b9fe6-b480ba5f-47cd4e34-a7e2a08a-e80c5b4b4c9896dff6d35e66"><ac:parameter ac:name="">_Toc172823841</ac:parameter></ac:structured-macro><ac:structured-macro ac:name="anchor" ac:schema-version="1" ac:macro-id="2cd3ed878679f8bd-97ebf4d1-48ca4b7e-bb08bcf7-989859cfecb63c68ae84ccd0"><ac:parameter ac:name="">_Toc140564169</ac:parameter></ac:structured-macro>Data Display Press the \[*Data Display* \] button !image002.png! on the toolbar to present graphs displaying the data. The splitter is normally positioned on the left of the display. |
...
Since release 2007.02, the display offers also the opportunity to show longitudinal profiles. In such graph, the parameter values (Y-axis) are plotted against the river chainage (X-axis). The graph can progress over time, eitehr step by step or animated, via the time control toolbar, described in the Spatial display. both the graph and table will change over time as they shown data along the profile. 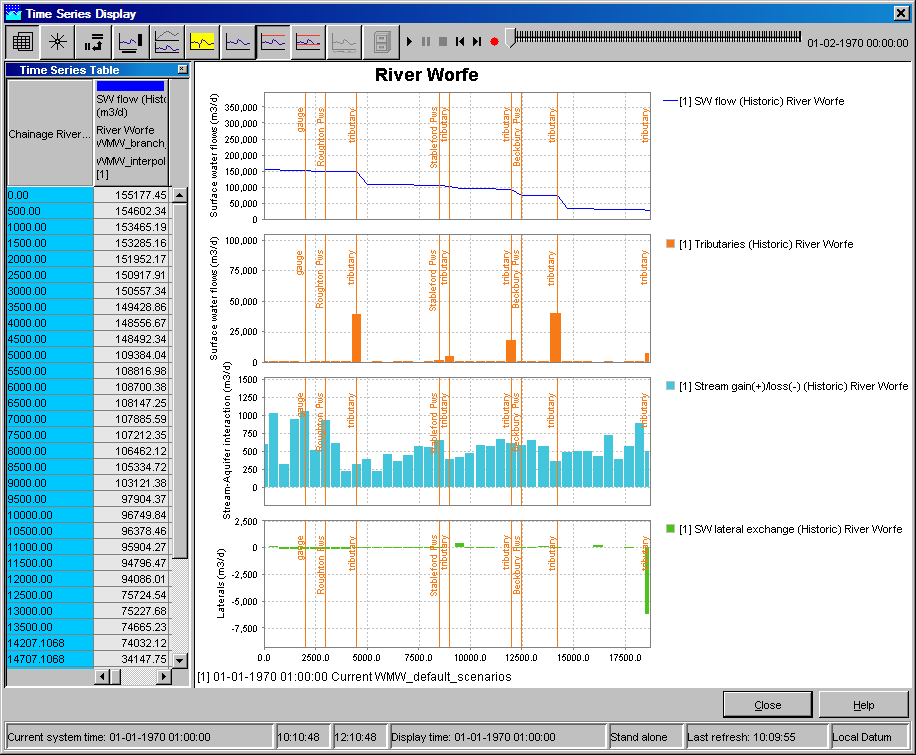
Category plot
In Category plot the parameter values (X-axis) are plotted against the locations (Y-axis).
The bars can be drawn standard or stacked.
If there are more subplots in a plot, a separate table wil be created for each subplot.
The graph can progress over time, either step by step or animated, via the time control toolbar. Both the graph and table will change over time
The detail description of this time toolbar can be found in paragraph Spatial display.
Configuration
To show the data in the category plot, the 'category' plot viewer type should be specified in DisplayGroups.xml with element <plotViewerId> :
| No Format |
|---|
<plot id="MODISCategory1Plot">
    <subplot>

        <timeSeriesSet>
            <moduleInstanceId>ImportModis</moduleInstanceId>
            <valueType>scalar</valueType>
            <parameterId>OWA</parameterId>
            <qualifierId>Aspect-ID   0</qualifierId>
            <locationSetId>ImportModis</locationSetId>
            <timeSeriesType>external historical</timeSeriesType>
            <timeStep unit="hour" multiplier="1"/>
            <relativeViewPeriod unit="hour" start="-24" end="4"/>
            <readWriteMode>read only</readWriteMode>
        </timeSeriesSet>

        <timeSeriesSet>
            <moduleInstanceId>ImportModis</moduleInstanceId>
            <valueType>scalar</valueType>
            <parameterId>SFR</parameterId>
            <qualifierId>Aspect-ID   0</qualifierId>
            <locationSetId>ImportModis</locationSetId>
            <timeSeriesType>external historical</timeSeriesType>
            <timeStep unit="hour" multiplier="1"/>
            <relativeViewPeriod unit="hour" start="-24" end="4"/>
            <readWriteMode>read only</readWriteMode>
        </timeSeriesSet>

    </subplot>
    <plotViewerId>category</plotViewerId>

</plot>
|
Restrictions
The category plot can be customized in TimeSeriesDisplay.xml and in DisplayGroups.xml, similar to the other plot types. However not all configuration elements are applicable to the category plot. If these elements are still configured, they wil be ignored.
The category plot is only applicable to scalar timeseries.