Some examples on how to connect to the FEWS PI-JSON REST Web Service:
Python
To get time series from FEWS using python the following example uses the requests module and reads the time series data into a dictionary.
import requests

url = 'http://localhost:8080/FewsWebServices/rest/fewspiservice/v1/timeseries'
params = dict(
    documentVersion='1.23',
    documentFormat='PI_JSON'
)
response = requests.get(url=url, params=params)
data = response.json()
To see an example of creating a time series plot with python using matplotlib, see the following Python Matplotlib time series example.

Javascript
Using popular javascript libraries like leaflet, jquery and mapbox a web application can be made using the FEWS PI-JSON REST Web Service. The following example shows how to get all locations from FEWS and plot them on a map:
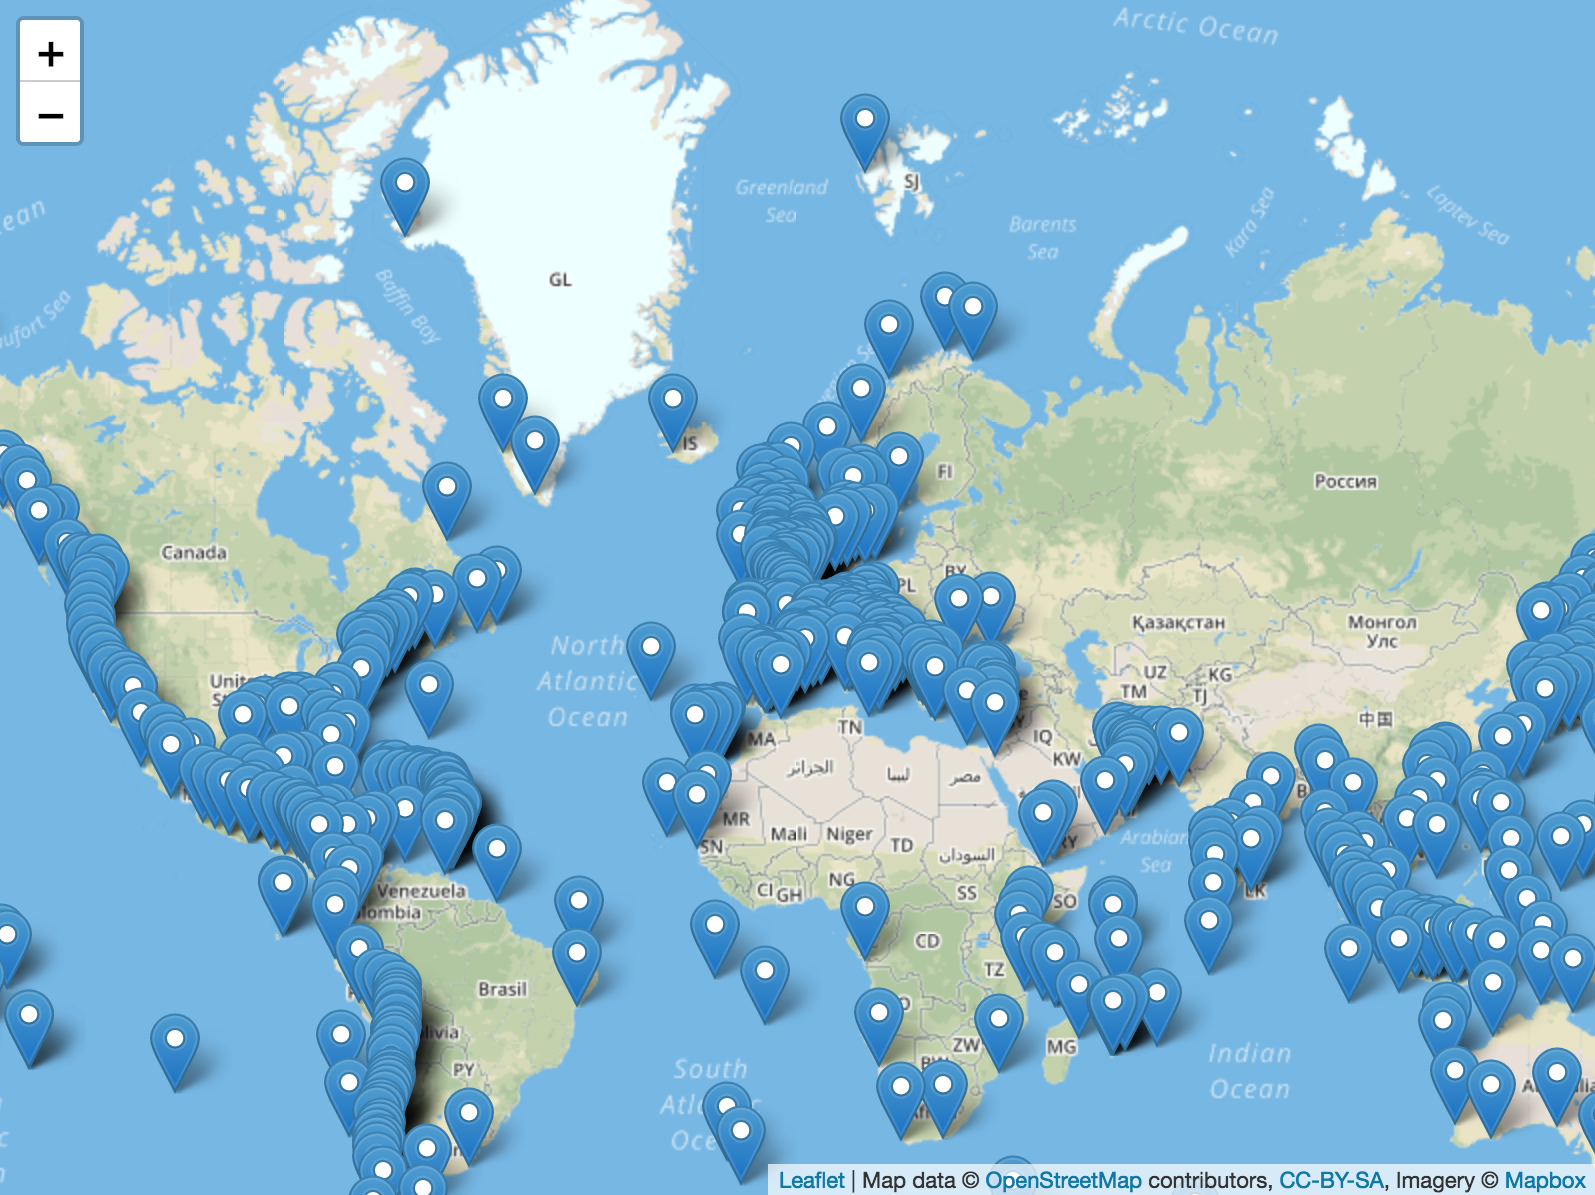
This requires the following html/javascript code:
<!DOCTYPE html>
<html>
<head>
<title>Delft-FEWS PI-JSON REST Web Service - Leaflet MapBox example</title>
<meta charset="utf-8"/>
<meta name="viewport" content="width=device-width, initial-scale=1.0">
<link rel="stylesheet" href="https://unpkg.com/leaflet@1.3.1/dist/leaflet.css"/>
<script src="https://unpkg.com/leaflet@1.3.1/dist/leaflet.js"></script>
<script src="https://ajax.googleapis.com/ajax/libs/jquery/3.3.1/jquery.min.js"></script>
</head>
<body>
<div id="mapid" style="width: 800px; height: 600px;"></div>
<script>
// Get all locations from FEWS using the PI_JSON format and show them on a map
var url = 'http://localhost:8080/FewsWebServices/rest/fewspiservice/v1/locations?documentVersion=1.23&documentFormat=PI_JSON';
var mymap = L.map('mapid').setView([51, 0], 2);
L.tileLayer('https://api.tiles.mapbox.com/v4/{id}/{z}/{x}/{y}.png?access_token=pk.eyJ1IjoibWFwYm94IiwiYSI6ImNpejY4NXVycTA2emYycXBndHRqcmZ3N3gifQ.rJcFIG214AriISLbB6B5aw', {
maxZoom: 18,
attribution: 'Map data © <a href="http://openstreetmap.org">OpenStreetMap</a> contributors, ' +
'<a href="http://creativecommons.org/licenses/by-sa/2.0/">CC-BY-SA</a>, ' +
'Imagery © <a href="http://mapbox.com">Mapbox</a>',
id: 'mapbox.streets'
}).addTo(mymap);
var callback = function (status, data) {
if (status === 'ok') {
$.each(data.locations, function (key, val) {
L.marker([val.lat, val.lon]).addTo(mymap)
.bindPopup("<b>" + val.shortName + "</b>");
});
}
};
$.getJSON(url, callback.bind(this, 'ok')).fail(callback.bind(this, 'error'));
</script>
</body>
</html>