In order to use HABITAT for ecological effect analysis, we propose to follow the following steps:
1) Determine the objective of the use of HABITAT.
What question do you want to answer?
For example: What are the effects of changes in water level fluctuation on ecology?
2) Make the question more specific in terms of ecological parameters.
For example: What are the effects in terms of suitable habitat for macrophytes and the Rhodeus sericeus amarus ?
3) Describe the habitat requirements for the species or group of species.
In other words: describe the environmental conditions needed.
For example (in short):
The growth of submerged macrophytes is mainly determined by light availability. The light availability is influenced by algae concentration, suspended sediment, detritus and humus acids. Furthermore, the sediment type and salt concentration determine the growth of macrophytes. Wind fetch sometimes disturbes the growth of macrophytes, although submerged macrohytes are less limited by this. In some areas the feeding of birds on macrophytes is an important limiting factor, especially in period late summer to autumn.
Determine also what the most important factors are for the occurrence of a (group of) species. Consider whether these factors are enough to answer the central question of the study.
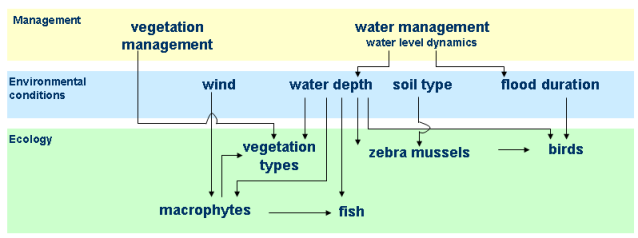
4) Analyse the Effect chain. How does the pressure, autonomic development or water management strategy affect the habitat suitability directly or indirectly? A direct influence is for example: the grazing by birds or land use management by mowing. Indirect effects are all the effects via the environmental conditions. For example, changes in water level result in changes in water depth, which is an important environmental condition for macrophytes. A more complex example is given in the figure below.
Reconsider the selected environmental factors for the habitat requirements. Are the most important factors to assess the effects of the scenario and/or management strategy included in both the habitat requirements and process effect chain?
5) Import response curves from the ecological library or make your own response curves.
Make your own response curves in HABITAT:
- HABITAT starts with a with new project. You can also make your own new project if necessary by selecting from the menu File, New Project
- Add new folder. Select from the menu File, New Project or right click with mouse and select Add New Folder. You can change the name of the folder by typing a new name in the properties window.
- Add new composite model. Right click with mouse at the project and select_Add Item. Select Composite Model
- Add new model. Right click with the mouse on the composite model and select Add New Model
- Select a suitable modeltype from the menu
- Enter file name of the input variable.
- Enter the file path of the input variable by typing or double click to either browse to the input map or select an input map which is used in previous models under the folder. Give a description of the map and enter the units.
- Enter the function equation, classification table or broken linear table to specify the response curve.
- Enter the name of the output variable.
- Add an other model if needed.
Learn more about Modeltypes and configuring them.
6) Make the calculation.
You may either run
- a model seperately or,
- a group of models in a composite model,
- all the composite models present in a project.
To do this right click at a model, composite model or project or select from the menu _Run, Run all models.
7) Analyse results.
- Open the map files (input and output) by double click on a specific map in the project explorer.
- Change legend. Go to the tab 'Map Contents' and double click the map name. In the tab 'style' you can make your own legend when you choose the option 'quantity'. In the other styles the legend is created automatically.
- Look at the values by clicking with the mouse on the map. The values are presented in the properties. Or select the
 button in the toolbar to view the values when you move with the mouse around your map. It is also possible to view values of multiple maps. To do that rightclick on your project in the project explorer, add new item, select 'map'. Now you can drag the maps you want to view in the main screen of your 'map' and compare the values with the button.
 - Execute a Spatial Statistics.
See also the quickstart movies on how to use the user interface of HABITAT.