 Version: 30 November 2017
What is the Pathways Generator?
The Pathways Generator helps you explore policy pathways in an interactive way, for example, together with stakeholders. The results are shown in a pathways map. Pathways are sequences (or portfolios) of actions over time to achieve a set of pre-defined objectives under uncertain and changing future conditions. Pathways are part of a policy and planning framework (e.g. Dynamic Adaptive Policy Pathways (DAPP)[1]), which incorporates the evaluation of costs and benefits with monitoring to track both policy implementation and any changing conditions. The DAPP approach is built upon the notion that decisions are made over time in dynamic interaction with the system of concern and cannot be considered independently. In the same way that all roads lead to Rome, there are also countless paths to reach the future.
Click on the two figures below to view example pathways maps generated using the Pathways Generator.
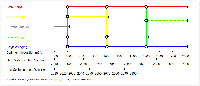
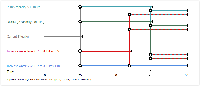
Figure 1: River sedimentation & navigation Figure 2: IJsselmeer under climate change induced sea level rise
How to use the Pathways Generator
The Pathways Generator is a simple touchscreen-enabled application. To use the program:
1. Download the executable onto your computer and start the programme by double clicking on it.
2. Choose approach
In the current version, there are two ways to generate pathways:
Using adaptation tipping points based on the conditions under which a policy fails. Scenarios are then used to assess the timing of the tipping points. This results in a single pathways map with scenario axes grouped together along the base of the map.
Using the timing of adaptation tipping points determined from an analysis of different scenarios. This results in a series of pathways maps; one per scenario, each with an analogous time axis.
In method 1, a vulnerability assessment can be used to assess main conditions for unacceptable performance of the system under consideration (e.g. at sea level rise of 1 m, the performance is unacceptable; with action X acceptable performance is reached until 2 m of sea level rise). In method 2, the performance of the current situation and potential adaptation actions are assessed over time using either transient or semi-static analyses, before being compared to threshold values for unacceptable performance. Method 2 is also particularly useful in situations where a single overarching performance condition cannot be specified due to competing performance requirements.
3. Add Actions
After selecting your approach, specify the characteristics (tipping points) of the current system and any policy actions [click on '+', followed by 'Add action']. This can be done for several actions. Either add the conditions under which a tipping point is reached (method 1) or the time at which the tipping point is reached in your base scenario (method 2). Any actions that rely on a preceding action being completed prior to being implemented can be stipulated in the 'Opportunity Tipping Point' section of the 'Add action' dialog.
4. Generate Pathways
After adding all actions, start generating pathways [click on '+', followed by 'Add pathway']. Select the first action/path and the subsequent action in the dropdown lists. Identify whether the pathway is a combination of actions (both stay implemented and will be maintained) or a sequence of actions (one action commences after an earlier action concludes). Combination actions are drawn with dashed lines combining all constituent action colours.
5. Add Scenarios
You can add scenarios to your pathways map(s) [click on 'Scenarios']. Scenarios create a link between conditions and timing (condition based pathways, method 1), or allow you specify additional values for the timing of tipping points (time based pathways, method 2).
- For method 1, specify a start year and number of time steps for your base scenario [click on '↔'], before stipulating the condition values for any key years [click on 'Add scenario' button, complete data table]. Any values between those specified will be automatically linearly interpolated. This can then be repeated for any additional scenarios.
- For method 2, specify a start year and number of time steps for your base scenario [click on '↔'], before adding the desired number of scenarios [click on 'Add scenario' button]. Return to the Pathways map [click on 'Pathways'] and edit tipping point (time) values for each action in each scenario. Either select each action and edit the values in the right-hand properties column, or use the main pathways data table [click on 'Toggle display' button] and edit tipping point values for actions in each scenario column directly there. The individual pathway maps for each scenario can then be viewed by selecting the desired scenario from the dropdown list located at the top of the properties column.
6. Modify the Pathways Map
Modify the general appearance of the pathways map using the 'Settings gear' button. 'Xaxis Settings' allows you to define a caption and range for the x-axis of the map, while 'Graph Settings' allows you to define the map size and margins, among other things.
You can also vertically drag and drop pathways within the map to alter the order in which actions appear. Tipping points can be modified in a similar fashion for each path using the horizontal drag and drop function. Minor adjustments to both horizontal and vertical pathway placements can be achieved using the four nudge buttons ('up', 'down', 'left', 'right') located above the right properties column.
7. Evaluate your pathways
You can use the scorecard to qualitatively evaluate the relative benefits, costs and any side effects of each pathway [click on 'Scorecard']. Simply select each pathway in the table and assign the desired number of positive '+' or negative '-' scores in each column using the toolbar buttons [click on '+' or '-']. You can then sort the table according to benefits, costs or side effects (either ascending or descending) [click on desired sorting column heading], or revert the scorecard back to match the order in the main pathways table [click on 'Sort' button in the toolbar].
8. Save your work
You can save all your data at any time for future editing in the Pathways Generator using the 'Save' button. This will ask you to store a .pathway file on your local hard drive.
You can also export the pathways map and scorecard images in either PNG or EMF formats, and any tabulated data may be exported in the CSV format. Simply navigate to the screen of interest (i.e. Pathways, Scenarios, Scorecard) and click on the 'Export' button to the right of the 'Save' button. Choose the desired file type from the dropdown menu. The available file types change depending upon which screen is selected and relate exactly to what you can see on the screen in front of you at that time.
Instruction manual
View / Download a brief manual to help navigate the Pathways Generator interface and learn about its basic functionalities.
Video Tutorials
Two short instructional videos illustrating how to create pathways maps, can be found on the following two pages. Please note that these demonstrate an earlier version of the software, however the core functionality remains the same in the present version:
Both videos use the navigation example illustrated above.
Compatibility
At present the Pathways Generator currently only works on Windows operating systems. To use the application on other operating systems (e.g. macOS), you presently need virtualisation software such as VirtualBox (Various OS, Free/Open-source), Parallels (Mac only, Licensed) or VMWare Fusion (Mac only, Licensed). This software can be used to install a version of Windows on your non-Windows computer.
Conditions for use

This work is licensed under a Creative Commons Attribution-NoDerivatives 4.0 International License.
The Pathways Generator is free for all to use and distribute. There are no extra or hidden costs to obtain or use the software, provided that proper reference is given to its use, developers and the DAPP methodology (see About, below).
Deltares and Carthago Consultancy shall not be responsible for any loss, damage or other expenses of any kind incurred by either you as a user of the Pathway Generator, or third parties (partially or wholly) due to the use of the Pathways Generator and the interpretation and use of the results it generates.
To build upon the Pathways Generator’s capabilities, involve us in your projects to help fund these developments.
Share your experience
Please share your experiences of using the Pathways Generator with us! Share your pathways maps, along with any publications where available. If possible, we will post them on this website to share with the ‘pathways community’. Your feedback on the tool is valuable in order to improve and elaborate it. Contact details are at the bottom of this page.
Join in the development!
The Pathways Generator is a living project. The version that you are working with is the co-production of many partners. We are always seeking to further develop the software, and would welcome your collaboration. If you identify a potential capability that you want incorporated into the Pathways Generator, please contact us to involve us in your project. We would also welcome hearing from you should you wish to contribute to crowdfunding future developments. Proper recognition for any resources received would of course be given within the application and its associated documentation.
If you would simply like to be kept informed and receive updates on the tool, please contact us and we will include you on our mailing list.
About
The Pathways Generator is developed by and remains the copyright of:
Deltares
Delft, The Netherlands
www.deltares.nl
Carthago Consultancy
Rotterdam, The Netherlands
www.carthago.nl
Development to date has been generously made possible by the following parties/projects:
Deltares, NL
Carthago Consultancy, NL
Wellington City Council, NZ
Ministry for the Environment, NZ
- NZ Climate Change Research Institute, Victoria University of Wellington
RISES, the European Union’s Seventh Programme for Research, Technological Development and Demonstration under Grant Agreement No:FP7-ENV-2013-Two-Stage-603396- RISES-AM-
- Haasnoot, M., J.H. Kwakkel. W.E. Walker, J. ter Maat. (2013). Dynamic Adaptive Policy Pathways: A Method for Crafting Robust Decisions for a Deeply Uncertain World. Global Env. Change, 23 (2) 485–498 DOI: 10.1016/j.gloenvcha.2012.12.006
- Haasnoot M., H. Middelkoop, A. Offermans, E. van Beek, W.P.A. van Deursen (2012). Exploring pathways for sustainable water management in River deltas in a changing environment. Climatic Change. 115 (3-4), 795-819 DOI: 10.1007/s10584-012-0444-2
- Kwadijk, J.C.J., M. Haasnoot, et al.(2010). Using adaptation tipping points to prepare for climate change and sea level rise: a case study in the Netherlands. Interdisciplinary reviews: Climate Change. DOI: 10.1002/wcc.64
Contact
For any suggestions or questions regarding the Pathways Generator, please feel free to contact any of the below individuals:
Andrew Warren
andrew.warren@deltares.nl
Marjolijn Haasnoot
marjolijn.haasnoot@deltares.nl
Willem van Deursen
wvandeursen@carthago.nl