System Monitor
The System Monitor display allows you to view the status of the system. Its behavior varies depending on whether the system is used in Standalone mode or as an Operator Client.
In Standalone mode, the System Monitor displays the Log Browser, Forecaster Notes, Batch Forecast tab, Import Status, and, since version 2021.02, Running Forecasts. An overview of the tabs available in the System Monitor for a Standalone system is shown below.

In an Operator Client, the System Monitor displays several tabs for monitoring different aspects of the live system. An overview of the tabs available in an Operator Client when logged into a live system is illustrated below.

Each of the System Monitor tabs is detailed in the following paragraphs.
Log Browser
The Log Browser presents system messages in a spreadsheet-like format. Messages can be sorted according to user-defined criteria. Fatal and severe system errors can be acknowledged by the forecaster as reviewed. Once all errors from the past 48 hours have been acknowledged, the system status icon at the lower right of the FEWS Explorer will turn green again. Since 2024.01 log messages older than 48 hours will be acknowleged automatically by the system.
Using [Refresh], the Log Browser is updated with new system messages. Note that the query settings (see below) determine which messages are displayed. With [Close], the user can exit the Log Browser.

Upon opening, the same information is displayed as in the Log Viewer. Per message, the Log Browser provides the following information:
- Log level (see table above)
- Log creation time
- Event code (see Appendix A for listing)
- Log message (description)
- taskRunId
The following type of system messages are identified in the table below.
Log Level | Icon | Description |
Fatal |
| Severe errors that cause premature termination |
Error |
| Other runtime errors or unexpected conditions |
Warn |
| Events that are undesirable or unexpected, but not necessarily wrong |
Info | no | Runtime events (startup/shutdown) that allow tracking of the progress of the system |
Log messages can be sorted by clicking the header of a column.
Double-click a message to open its details (see example below). From the details view, the message can be saved to a file or printed.

Query definition
A query can be defined to display only a subset of messages in the Log Browser. The following options are available:
Log level
Select a log level from the dropdown list. All messages with this level or higher will be displayed. For example, selecting INFO shows all messages, while selecting FATAL shows only messages with log level FATAL.Log creation time
Display messages created within a specified time period. The period is defined by entering an end time and the duration (in hours) preceding the end time.Event code
Enter symbols in this field to display only messages that start with the specified symbols.Token in Message
Enter symbols in this field to display only messages that contain the specified symbols.
The display is updated based on the user-defined query when [Refresh] is pressed.
Acknowledging messages
All messages with level ERROR or FATAL must be acknowledged to confirm that they have been reviewed and appropriate action has been taken.
Messages with level WARN may also be acknowledged, but this is only necessary to clear the opaque warning icon in the status bar if the setting <showIconForUnacknowledgedWarnings>true</showIconForUnacknowledgedWarnings> is enabled in explorer.xml. By default, this setting is false (see showIconForUnacknowledgedWarnings).
To acknowledge a message, double-click its icon or use the Acknowledge button. Multiple messages can also be selected and acknowledged at once. To quickly select all unacknowledged messages, choose Not acknowledged in the Log Level dropdown and refresh the log messages.
Tip: You can also press [Ctrl+A] after selecting a single message to select all messages at once. When all ERROR messages have been acknowledged, the system status icon in the Explorer will turn green (or opaque if showIconForUnacknowledgedWarnings is set to true).

Debug messages
Please note that a System Manager can configure the system to generate Debug Messages. These messages log internal application events for system development and management. Typical debug events include the creation of a database connection or exceptions caused by programming or configuration errors.
Debug messages are not displayed in the Log Viewer. Instead, they are written to a log file named log.txt located in the regional configuration folder.
Live System Status
The Live System Status tab displays the current status of the live system. It provides three status lists showing:
Currently dispatched forecasts (task runs)
Currently executing forecasts (task runs)
Status of the Master Controllers
Status of the Forecasting Shells
These lists reflect the currently configured Master Controllers and Forecasting Shells. From this overview, users can see whether the components are Alive or Down.

Scheduled Forecasts
The Scheduled Forecasts tab displays a list of all scheduled forecasts, along with key details for each forecast. The following information is included:
Task ID – A unique identifier generated by the Master Controller.
Description – A description provided by the user who scheduled the forecast.
Workflow ID – The identifier of the scheduled workflow. This may include both Forecasting Shell workflows and Master Controller workflows.
MC ID – The identifier of the Master Controller where the task is scheduled.
Priority – Indicates whether the task has high or normal priority.
Repeat Time – The repeat interval of the task, in minutes.
Next Due Time – The next scheduled execution time of the task.
Task Status – The current status of the task, which can be suspended or pending. Suspended tasks typically depend on a trigger (e.g., a threshold crossing) before they can run.

In the Scheduled Forecasts tab, a user can:
Cancel a scheduled task by clicking [Cancel].
Suspend a scheduled task by clicking [Suspend].
Resume a suspended task by clicking [Resume].
Pause a scheduled task for up to five runs by clicking [Pause] and completing the popup form (see below). Pausing can be undone by resetting the number of runs for which the task is paused to 0.

Please note that not all options are available for every workflow. For example, a user normally cannot cancel the current forecast or import runs scheduled by the superuser. Additionally, the status of system management workflows typically cannot be changed by a user.
Running Forecasts
The Running Forecasts tab displays a list of all tasks currently running on a Forecasting Shell, including information about each task and the Forecasting Shell it is running on.
Since version 2021.02, this tab is also available in Standalone mode, with a new column:
Activity – Shows the current module instance that is running. This will display a number greater than 0 only when the execute activities in the General Adapter either read progress from the executable’s console and/or have
<activityDurationWeight>configured (see the console element of the General Adapter).
If the option <updateModuleRunTimesOnCompletion> is configured in ModuleInstanceDescriptors.xml, FEWS records the last run duration. This information is then used to estimate the expected completion time for the next run of the workflow. To view these estimates at the module level in the bottom table, select the task in the top table of the Running Forecasts tab.
Note that the module progress (bottom table) is an estimate based on previous runs, whereas the task progress (top table) is typically based on actual progress reported by the General Adapter.

A manually dispatched task can be killed by pressing on the 'Kill Running Task' button. Note that this is a hard process kill which may lead to corruption of the local datastore.
Batch Forecasts
The Batch Forecast tab lists the forecasts submitted from the Manual Forecast display in a Standalone system. All submitted forecast runs can be stopped by clicking [Stop].

Import Status
The Import Status tab provides information on the most recently imported files. For each import task, the tab shows:
The file name of the last imported file, including the date and time of import.
The total number of files imported in that task.
The number of failed imports.
By default, all data feeds are visible in the Import Status tab. If certain data feeds are not relevant, they can be hidden using the disableDataFeedInfo option in the TimeSeriesImport configuration file. Since version 2019.02, obsolete data feeds can also be deleted from the admin interface. See Files - Import Status.
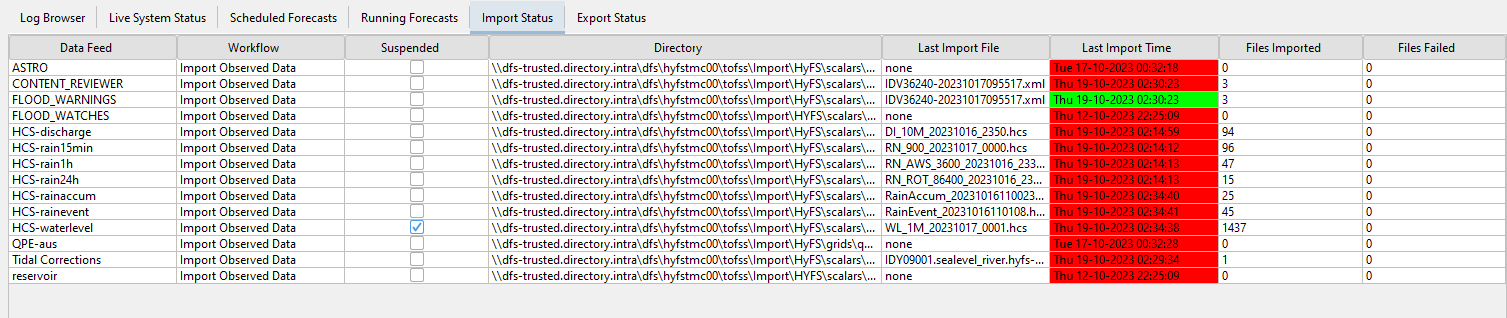
Last import time is updated only if at least one file has been successfully imported. The cell in the column ‘Files Failed’ is colored red when there is one or more files failed.
Export Status
The Export Status tab provides information on the files that were last exported. For each export task the file name of the last exported file is shown including the date and time of the export. Also the number of files that were exported in that task are shown, with the number of failed exports.
By default all data feeds are visible in the Export Status tab. If some data feeds are not wanted, for example because they are not really relevant, one can use an option disableDataFeedInfo in the TimeSeriesImport config file. See Files - Export Status.

Last export time is updated only if at least one file has been successfully exported. The cell in the column ‘Files Failed Count’ is colored red when there is one or more files failed.