Thresholds Display & TRITON Display
Information about thresholds crossings is of prime importance in a forecasting system. If and when a threshold crossing occurs, a log message is generated and the location icon is updated in the FEWS Explorer. The log message can be viewed in the system monitor and in reports.
The Thresholds display provides an additional means to view and analyse threshold crossings. The module provides a number of different ways to obtain an overview of all threshold crossings. The TRITON display is a specific version of the Threshold display.
For a selected forecast, the Thresholds display presents information in three different views:
- Threshold status view
A general overview of thresholds, for a group of location and individual locations. Multiple threshold status views may be configured, for example to view the threshold status over a certain length of time, at precise times or per hour.
- Alarm summary view
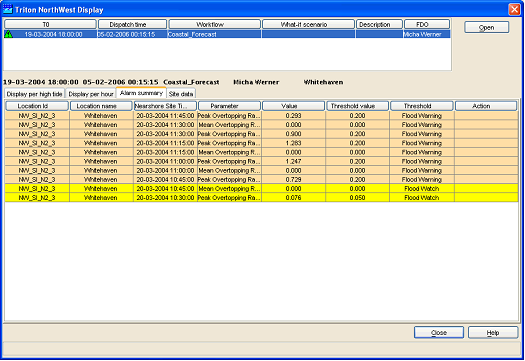
The Alarm summary view presents a table of all threshold crossings.
- Site data view
For a selected time series the Site data view will present any number of time series that may be of importance
Selecting a Workflow for Display
The workflow for which data should be displayed in the Threshold display can be selected at the top of the screen. Place your cursor on the workflow you would like to display and click [Open]. The selected workflow is shown in bold above the tabs.

Threshold Status View
The threshold status view can be configured to display the threshold status of any number of time series over a period of time. Examples of frequently used settings are:
- For coastal forecasting the threshold status at high tide. The input data is non-equidistant and all values are shown. See the example below, where Triton results are shown at high tide.
- For coastal forecasting the threshold status per hour. This shows how the threshold status develops in a 24 hour period over successive high tides.
- For fluvial forecasting over any duration. The example given provides an overview over 4 hour durations.

Coastal forecasting example: thresholds at high tides

Coastal forecasting example: thresholds per hour. High tide as in the previous example is at 10:45.
__

Fluvial forecasting example: threshold status over a 4 hour period
Alarm Summary View
The alarm summary view will present a table of all alarms for the selection of location(s) made in the Threshold Status View.
Site Data View
The site data view will present a table of data for the selected location.
