Summary
This howto describes how to configure a preferred equation for a correlation plot (using the correlationdisplay). It describes how to adjust the CorrelationDisplay config file and/or the traveltimes file to select a default for a specific correlation.
Description
The files defining what is shown in the correlation display are stored in the DisplayConfigFiles directory. For each correlation a number of elements must be configured:
- inputTimeSerieInfo: Historic time series sets information.
Parameter id is required for calculating correlation. The other variables are required for running the forecast hydrograph. - eventSetsDescriptorId: Correlation event sets descriptor ID
- travelTimesDescriptorId: Travel times descriptor ID
- eventSelectionType: Selection type: event id selection or travel time selection.
A (new) optional element has been added which allows to set a preferred equation-type for the selected correlation: defaultEquation. This elements has to attributes: equationType (required) and polynomialOrder (optional). This element should be the last element of a CorrelationDisplay config file.
The following options are available for the equationType attribute:
- polynomial
- simple_linear
- multiple_linear
- exponential_divide
- exponential_multiply
- power
- logarithmic
- hyperbolic
This setting can be used to change the default for an entire group. To set the default for a single upstream/downstream combination the same element can also be set in the traveltimes file.
Configuration Steps for the CorrelationDisplay config file
- Open an existing configuration file. In xmlspy grid view it may look like this:
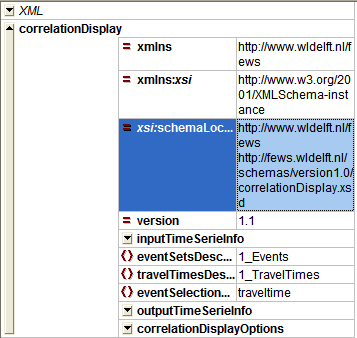
In XML it will look like this:
<?xml version="1.0" encoding="UTF-8"?>
<correlationDisplay xmlns="http://www.wldelft.nl/fews" xmlns:xsi="http://www.w3.org/2001/XMLSchema-instance" xsi:schemaLocation="http://www.wldelft.nl/fews http://fews.wldelft.nl/schemas/version1.0/correlationDisplay.xsd" version="1.1">
	<inputTimeSerieInfo>
		<moduleInstanceId>ImportTelemetry</moduleInstanceId>
		<parameterId>H.obs</parameterId>
		<timeSeriesType>external historical</timeSeriesType>
		<timeStep unit="minute" multiplier="15" divider="1"/>
		<relativeViewPeriod unit="day" end="2" start="-4"/>
		<readWriteMode>add originals</readWriteMode>
	</inputTimeSerieInfo>
	<eventSetsDescriptorId>1_Events</eventSetsDescriptorId>
	<travelTimesDescriptorId>1_TravelTimes</travelTimesDescriptorId>
	<eventSelectionType>traveltime</eventSelectionType>
	<outputTimeSerieInfo>
		<moduleInstanceId>ImportTelemetry</moduleInstanceId>
		<parameterId>H.simulated</parameterId>
		<timeSeriesType>simulated forecasting</timeSeriesType>
		<timeStep unit="minute" multiplier="15" divider="1"/>
		<relativeViewPeriod unit="day" start="-4" end="2"/>
		<readWriteMode>add originals</readWriteMode>
	</outputTimeSerieInfo>
	<correlationDisplayOptions>
		<scatterplotOptions>
			<preferredColor>red</preferredColor>
			<markerStyle>circle</markerStyle>
			<markerSize>8</markerSize>
		</scatterplotOptions>
		<equationOptions>
			<lineStyle>solid</lineStyle>
			<markerStyle>none</markerStyle>
		</equationOptions>
	</correlationDisplayOptions>
</correlationDisplay>
- Now add the following to the end of the file (before the final </correlationDisplay> element): <defaultEquation equationType="simple_linear"/>. In xmlspy grid view it will now look like this:

<?xml version="1.0" encoding="UTF-8"?>
<correlationDisplay xmlns="http://www.wldelft.nl/fews" xmlns:xsi="http://www.w3.org/2001/XMLSchema-instance" xsi:schemaLocation="http://www.wldelft.nl/fews http://fews.wldelft.nl/schemas/version1.0/correlationDisplay.xsd" version="1.1">
	<inputTimeSerieInfo>
		<moduleInstanceId>ImportTelemetry</moduleInstanceId>
		<parameterId>H.obs</parameterId>
		<timeSeriesType>external historical</timeSeriesType>
		<timeStep unit="minute" multiplier="15" divider="1"/>
		<relativeViewPeriod unit="day" end="2" start="-4"/>
		<readWriteMode>add originals</readWriteMode>
	</inputTimeSerieInfo>
	<eventSetsDescriptorId>1_Events</eventSetsDescriptorId>
	<travelTimesDescriptorId>1_TravelTimes</travelTimesDescriptorId>
	<eventSelectionType>traveltime</eventSelectionType>
	<outputTimeSerieInfo>
		<moduleInstanceId>ImportTelemetry</moduleInstanceId>
		<parameterId>H.simulated</parameterId>
		<timeSeriesType>simulated forecasting</timeSeriesType>
		<timeStep unit="minute" multiplier="15" divider="1"/>
		<relativeViewPeriod unit="day" start="-4" end="2"/>
		<readWriteMode>add originals</readWriteMode>
	</outputTimeSerieInfo>
	<correlationDisplayOptions>
		<scatterplotOptions>
			<preferredColor>red</preferredColor>
			<markerStyle>circle</markerStyle>
			<markerSize>8</markerSize>
		</scatterplotOptions>
		<equationOptions>
			<lineStyle>solid</lineStyle>
			<markerStyle>none</markerStyle>
		</equationOptions>
	</correlationDisplayOptions>
	<defaultEquation equationType="power"/>
</correlationDisplay>
- Done: the display will now take this default instead of the normal one.
Configuration steps for the traveltimes file
- Open the he traveltimes file in which the correlation is defined you want to change.
- Add a defaultEquation element to each of the travelTime elements that you want to changes. See the figure below for an example.
