Zebra mussel - Dreissena polymorpha
General
General characteristics |
|
|---|---|
Common name | Zebra mussel - Dreissena polymorpha |
Region | The Netherlands, Europe |
Watersystem | Lakes, rivers |
Nature parameter | Molluscs |
Factsheet made by | K.E. van de Wolfshaar, M. Haasnoot |
|
Photo: Ron Offermans Source:kennislink.nl |

Descripton habitat
Occurence
The zebra mussel lives in rivers, lakes, pools and canals and attaches itself to solid substrates. In winter, zebra mussels are consumed in large quantities by water birds, such as the Tufted Duck (Aythya fuligula), the Common Pochard (A. Ferina), the Greater Scaup (A. marila) en the Eurasian Coot (Fulica atra). It is a small freshwater mussel that lives in fresh, large stagnant waters in the lower river basin.
Environmental boundary conditions
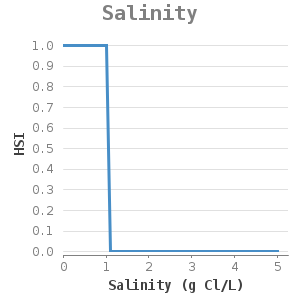
Fresh water, soil type, water depth and water temperature are important environmental conditions for the zebra mussel #2, #6.
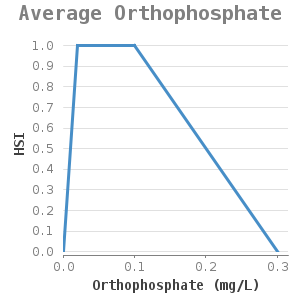
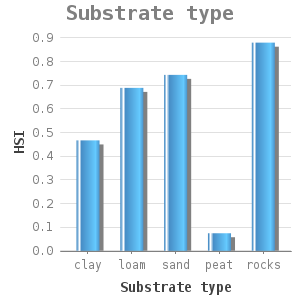
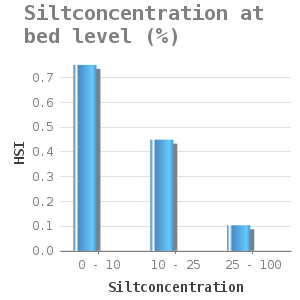
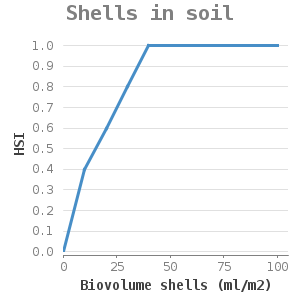
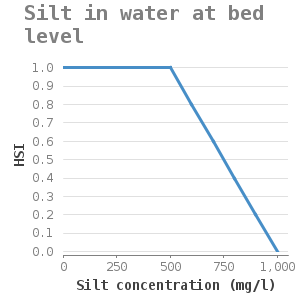
They attach themselves to solid substrate such as rocks and shells. Zebra mussels are filter-feeding organisms, they remove algae from the water column. Water and soil that contain high silt concentrations hinder filter-feeding and can eventually cause suffocation. Lab experiments on mussel filtration of the zebra mussel under various inorganic silt concentrations showed that the filtration capacity of the zebra mussel decreases with increasing silt concentrations (#11). A silt concentration of more than 1g/l hinders the filtration. These concentrations result not only in slow silt filtration but also in slow green algae filtration (#11). This way, the mussels might not obtain enough food (as they are too busy with the removal of silt through pseudofaeces) which can lead to a lack of growth or even death.
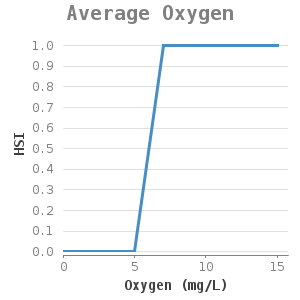
Most mussel colonies grow at various depths varying per area. There are reports of mussels at a depth of 50 metres (#9. Most concentrations can be found at a depth of 2-5 metres (#2). The zebra mussels do not occur in shallow areas, probably because of rapid temperature changes, mussel predator pressure or a high mortality rate in winter as a result of a long anaerobic period due to ice covering (#8). At larger depths, temperature and oxygen level are often limiting factors (#10).
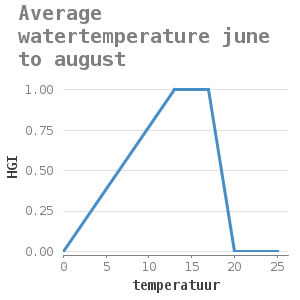
The water temperature influences the growth and reproduction of zebra mussels #2. The growth period is short and reproduction is minimal in cold water (<15˚C), Morton, 1969; Lewandowski, 1982; Strayer, 1991). Warm waters also have a negative effect on their reproduction (Walx, 1974). Mortality rate increases when temperature rises above 26-32˚C (Strayer, 1991). Noordhuis and Houwing (2003) suggest that relatively warm winters might have a negative effect. In Polish lakes, eggs and larval have been reported at water temperatures of 17-19 ˚C (Lewandowski, 1982) and in North American lakes at 13˚C (Hebert e.a., 1989).
For the lake Ijssel, the yearly spring growth of the zebra mussels start in April and ends in September. Research by Reeders (1989) showed that filtration rate is optimal at a water temperature of 5-20˚C. Filtration rates abruptly decrease if the temperature drops below 5˚C. When temperature is above 20˚C, the rate gradually decreases. According to research (Morton, 1969), longitudinal growth only takes place at a water temperature above 11 ˚C and it comes to a complete stop when the water temperature is over 30˚C. The zebra mussel is extremely sensitive for rapid water temperature rises. Therefore, the thermal shock method is used to control zebra mussels in cooling water systems: at a temperature of 35˚C all new growth is dead within half an hour (Jenner en Mommen, 1985). The growth of zebra mussels in the Randmeren is limited by a number of factors, including rapid water temperature rise and large daily temperature fluctuations, which can occur in shallow and sheltered lakes in spring. These changes can completely disturb the reproduction of zebra mussels (Vanhemelrijk e.a., 1993).
Control and growth opportunities
The occurrence of zebra mussels is mainly influenced by changes in salinity, water depth and water temperature.
Dose-effect relations
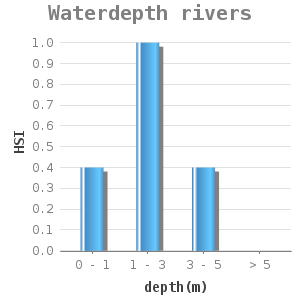
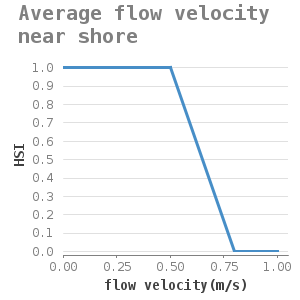
The dose-effect relations have been based on an extended study of TNO (#2) and an expert meeting (#3). For lakes and rivers, a distinction is made between water depth and flow velocity #2
Flowchart
Dose-effect relations general
Added dose-effect relations for lakes
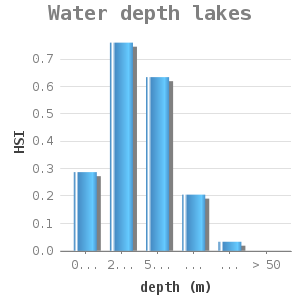
depth (m) | HSI |
|---|---|
0 - 2 | 0.287 |
2 - 5 | 0.76 |
5 - 10 | 0.634 |
10 - 25 | 0.205 |
25 - 50 | 0.033 |
> 50 | 0 |
Reference: #3
Uncertainty and validation
Dose effect relations have been validated for the lake IJssel (#4) and Lake Marken(#5, #7). For the lake IJssel validation, no effect relations for silt concentrations were taken into account. Effect relations have been taken into account for the Lake Marken validation. However, the silt concentrations were calculated for the year 2007 and the zebra mussel measurement was done in 2004. New data on zebra mussels can be expected in 2010/2011. A new validation has to be carried out, which will probably lead to a better model prediction, as the model mismatches measurement data mainly for those areas where silt is a limiting growth factor for zebra mussels.
occurrence correctly predicted | 0.69 |
|---|---|
absence correctly predicted | 0.80 |
occurrence wrongly predicted | 0.31 |
absence wrongly predicted | 0.20 |
The occurrence of the zebra mussel in the model has been set at a habitat availability of 0.5.
Applicability
These dose-effect relations have been applied to fresh waters in The Netherlands.
Exemplary project
Volkerak-Zoommeer Habitat analysis (#1).
Seizoensgebonden peil in het IJsselmeergebied (#12)
References
1 Haasnoot, M. en Van de Wolfshaar, K.E.. Habitat analyse in het kader van de Planstudie/MER voor Krammer, Volkerak en Zoommeer. WL report Q4015. 2006
2 Duel, H. en Specken B.. Habitatmodel Driehoeksmossel en andere modellen voor het voorspellen van de populatie-omvang van de Driehoeksmossel Dreissena polymorpha in meren en rivieren. TNO-BSA werkdocument P94-026 1994
3 Van der Lee, G., H. Duel, S. Groot, H. Aarts, R. Pouwels (2000). Kwaliteit van het HEP-instrumentarium voor toepassing in het IJsselmeergebied. WL | Delft Hydraulics, WL-rapport T2391
4 Haasnoot, M. (2004) Memo validatie rekenregels Driehoeksmossel IJsselmeer.
5 Van de Lee, G., H.F.P. van den Boogaard, W.E. Penning (2001). Achtergronddocument voor aanvulling van het habitatinstrument: 1. Flexibilisering invoer; 2. Onzekerheidsanalyse; 3. Validatie. WL rapport Q3433
6 Noordhuis, R. & EJ. Houwing, 2003. Oorzaken en gevolgen van een vermoedelijke "crash" met betrekking tot waterkwaliteit, slibhuishouding en natuurwaarden. RIZA rapport 2003.016, Lelystad.
7 Van de Wolfshaar, K.E., M. Haasnoot, 2007. Toetsing dosis-effect relaties HABITAT. Pilot voor het Markermeer en de Voordelta. WL-report Q4327. Download
8 Strayer, D.L. (1991). Projected distribution of the zebra mussel. Dreissana polymorpha, in North America. Can. J. Fish. Aquati. Sci. 48:1389-1395.
9 Laane, W.E.M. (1994). Habitatmodellen Driehoeksmossel, Hydropsyche contubernalis en Oeveraas. RIZA werkdocument, 96.044x.
10 Sprung, M. (1994). The other life: An account of present knowledge of the larval phase of Dreissana polymorpha. Ch.2 in Zebra Myssels, biology, impacts and control. Ed. by Nalepa F. and Schloesser D.W. pp 39-53
11 Dionisio 2009 Memo slibinvloed op driehoeksmosselen
12 Haasnoot et al (2005) Seizoensgebonden Peilen in het IJsselmeergbied Download