Create a Plot Layout
Introduction
In the report phase usually a plot is created, in which data from the setup, measurement and analysis phase are reported in a graph or table.
The layout of the plot must be defined before a test can be plotted.
Steps
Startup/Open
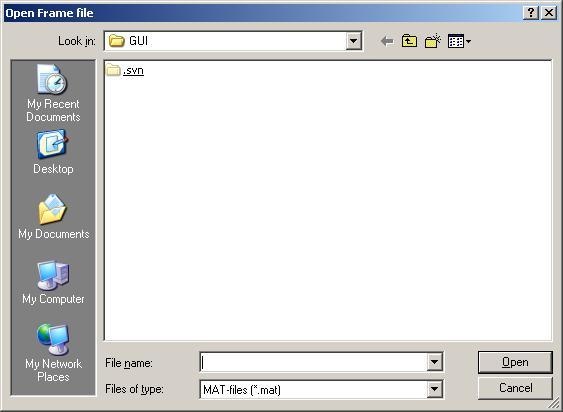
To edit an existing plot layout, start streamPlotSetup and choose the plot file concerned.

To create a new plot layout, press Cancel when being asked to open a Plot File. A dialog is shown to define the initial layout of the plot.

Explanation of the fields:
- Number of rows: (maximum) number of horizontal sections in the plot; this can be reset later on.
- Number of columns: (maximum) number of vertical sections in the plot; this can be reset later on.
Also a frame file can be chosen (optional).
Then an existing plot layout or an initial plot layout is being shown.

An area is being given an number.
For each area the positions are shown and can be edited. Positions are given in a normalized fraction of the total pagewidth and pageheight(0 to 1) from the bottom left point.
An area can be selected by selecting it by a mouse click or choosing the section or line in the dropdown box. Selected areas are being highlighted.
Define Areas
Plot areas can be edited changing the sizes of the areas.