| Anchor |
|---|
| _Toc154574472 |
|---|
| _Toc154574472 |
|---|
|
...
Use this element to show customized bar legend.
The following legend properties can be changed:
- position: legend can be placed on the right, on the left, at the top or at the bottom. Default is on the right.
- width: width of the bar in pixels. Default is 40 pixels.
- length: length of the bar in pixels. The defaults are 400 for legend on the right/left, and for the legend at the top/bottom the length equals the width of the window
- labelsInside: if true , ticks and labels are displayed inside the legend bar . The default is outside.
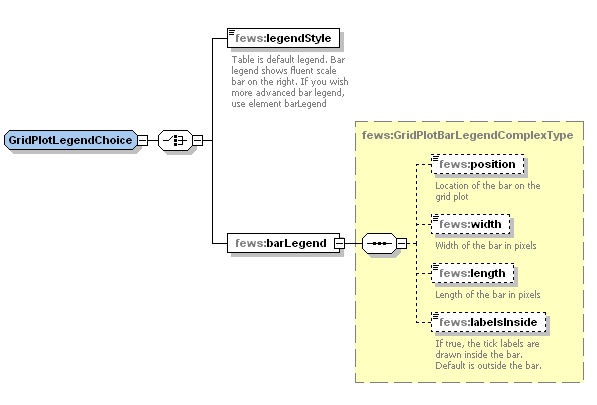
Elements of the configuration of legend style
...
To make use of a server that uses the open street map protocol
| Code Block |
|---|
| xml | xml |
|---|
| title | Demo Open Street Map |
|---|
| xml |
|---|
|
<openStreetMapLayer id="Osm">
<url>http://tile.openstreetmap.yourserver.com</url>
<cacheDir>$REGION_HOME$/OsmTiles</cacheDir>
</openStreetMapLayer>
|
...
- url : Base url for the wms server. This is everything before the text "VERSION=" in the url. Use & to include a &
- layer name : Layer name to display. It's the part after the text "LAYERS=" till the next & or ; in the url. To find the layer names enter the url that ends withs "request=GetCapabilities" in a browser.
| Code Block |
|---|
| xml | xml |
|---|
| title | Demo Aerial Photos Netherlands |
|---|
| xml |
|---|
|
<wmsLayer id="aerial">
    <url>http://gdsc.nlr.nl/wms/lufo2005?</url>
	<wmsLayerName>lufo2005-1m</wmsLayerName>
	<cacheDir>$REGION_HOME$/wms_areal_cache</cacheDir>
</wmsLayer>
|
| Code Block |
|---|
xml |
|---|
| xml |
|---|
| title | Demo with clouds Europe |
|---|
| xml |
|---|
|
<wmsLayer id="meteosat">
<url>http://geoservices.knmi.nl/cgi-bin/METEOSAT9_DEMO.cgi?&SERVICE=WMS&</url>
<wmsLayerName>IR108</wmsLayerName>
<cacheDir>$REGION_HOME$/wms_meteosat_cache</cacheDir>
</wmsLayer>
|
| Code Block |
|---|
xml |
|---|
| xml |
|---|
| title | Demo HIRMLAM temperature Europe |
|---|
| xml |
|---|
|
<wmsLayer id="HIRMLAM temperature">
<url>http://geoservices.knmi.nl/cgi-bin/HIRLAM_DEMO.cgi?&SERVICE=WMS&</url>
<wmsLayerName>2011-05-26T18:00:00Z/HIRLAM-temp/HIRLAM-temp-2m</wmsLayerName>
<cacheDir>$REGION_HOME$/wms_hirlam_cache</cacheDir>
</wmsLayer>
|
...
A very useful additional feature (to be used in the griddisplay only) is the feature that you can use the CTA as a real DEM and use it for plotting of water depths.
You then can easily display the water depths per pixel, based on a time series with water levels (using global datum!) and the DEM in the CTA. Therefore, enable the property useAsLocalDatumReference. Note, usesDatum in Parameters.xml for the respective parameterGroup should be set "true". The waterlevels can have any spatial distribution, like grid or polygon and should not have the exact same grid definition as the DEM. The calculation of the depths is completely on the fly and no depths have to be stored in the database.
| Code Block |
|---|
| xml | xml |
|---|
| title | Demo of using coverageTileArchiveLayer as background map |
|---|
| xml |
|---|
|
<coverageTileArchiveLayer id="asc">
  <file>petten.cta</file>
  <visible>false</visible>
  <useAsLocalDatumReference>false</useAsLocalDatumReference>
  <classBreaks>
    <lowerColor>brown</lowerColor>
    <upperColor>green</upperColor>
    <lowerValue>-4</lowerValue>
    lowerValue>-1</lowerValue>
  </classBreaks>
</coverageTileArchiveLayer>
|
| Code Block |
|---|
| xml | xml |
|---|
| title | Demo of using coverageTileArchiveLayer as DEM for plotting depths |
|---|
| xml |
|---|
|
<gridPlot id="Petten">
  <timeSeriesSet>
    <moduleInstanceId>Floodmap</moduleInstanceId>
    <valueType>grid</valueType>
    <parameterId>H.sim.hist</parameterId>
    <locationId>Floodmap_grid</locationId>
    <timeSeriesType>simulated historical</timeSeriesType>
    <timeStep unit="minute" multiplier="1"/>
    <readWriteMode>read only</readWriteMode>
  </timeSeriesSet>
  <classBreaks>
    <break lowerValue="0" color="light blue" opaquenessPercentage="25"/>
    <break lowerValue="1" color="blue" opaquenessPercentage="75"/>
    <break lowerValue="2" color="purple" opaquenessPercentage="75"/>
  </classBreaks>
  <geoMap>
    <geoDatum>Rijks Driehoekstelsel</geoDatum>
    <projection>mercator</projection>
    <defaultExtent id="Petten testmodel">
      <left>-1000</left>
      <right>10000</right>
      <top>4000</top>
      <bottom>0</bottom>
    </defaultExtent>
    <extraExtent id="Nederland">
      <left>-200000</left>
      <right>500000</right>
      <top>750000</top>
      <bottom>200000</bottom>
    </extraExtent>
    <scaleBarVisible>true</scaleBarVisible>
    <northArrowVisible>true</northArrowVisible>
    <labelsVisible>true</labelsVisible>
    <backgroundColor>light blue1</backgroundColor>
    <openStreetMapLayer id="osm" name="Open Street Map">
      <url>http://tile.openstreetmap.org</url>
      <cacheDir>$MAP_CACHE$/openstreetmaps</cacheDir>
    </openStreetMapLayer>
    <coverageTileArchiveLayer id="asc">
      <file>petten.cta</file>
      <visible>false</visible>
      <useAsLocalDatumReference>true</useAsLocalDatumReference>
      <classBreaks>
        <lowerColor>brown</lowerColor>
        <upperColor>green</upperColor>
        <lowerValue>-4</lowerValue>
        <lowerValue>-1</lowerValue>
      </classBreaks>
    </coverageTileArchiveLayer>
  </geoMap>
</gridPlot>
|
...
The following example shows how to configure a Meteosat image as grayScaleImage in the Grid display.
| Code Block |
|---|
| xml | xml |
|---|
| title | Extract of SpatialDisplay.xml |
|---|
| xml |
|---|
|
<gridPlotGroup id="Meteosat Images">
	<gridPlot id="MeteoSat">
		<timeSeriesSet>
			<moduleInstanceId>ImportMeteosat</moduleInstanceId>
			<valueType>grid</valueType>
			<parameterId>image</parameterId>
			<locationId>meteosat</locationId>
			<timeSeriesType>external historical</timeSeriesType>
			<timeStep unit="minute" multiplier="15"/>
			<relativeViewPeriod unit="hour" start="-12" end="36"/>
			<readWriteMode>read only</readWriteMode>
		</timeSeriesSet>
		<classBreaks>
			<lowerColor>black</lowerColor>
			<upperColor>white</upperColor>
			<lowerValue>0</lowerValue>
			<lowerValue>8</lowerValue>
			<lowerValue>16</lowerValue>
			<lowerValue>24</lowerValue>
			<lowerValue>32</lowerValue>
			<lowerValue>40</lowerValue>
			<lowerValue>48</lowerValue>
			<lowerValue>56</lowerValue>
			<lowerValue>64</lowerValue>
			<lowerValue>72</lowerValue>
			<lowerValue>80</lowerValue>
			<lowerValue>88</lowerValue>
			<lowerValue>96</lowerValue>
			<lowerValue>104</lowerValue>
			<lowerValue>112</lowerValue>
			<lowerValue>120</lowerValue>
			<lowerValue>128</lowerValue>
			<lowerValue>136</lowerValue>
			<lowerValue>144</lowerValue>
			<lowerValue>152</lowerValue>
			<lowerValue>160</lowerValue>
			<lowerValue>168</lowerValue>
			<lowerValue>176</lowerValue>
			<lowerValue>184</lowerValue>
			<lowerValue>192</lowerValue>
			<lowerValue>200</lowerValue>
			<lowerValue>208</lowerValue>
			<lowerValue>216</lowerValue>
			<lowerValue>224</lowerValue>
			<lowerValue>232</lowerValue>
			<lowerColor>orange</lowerColor>
			<upperColor>red</upperColor>
			<lowerValue>240</lowerValue>
			<lowerValue>248</lowerValue>
			<lowerValue>255</lowerValue>
		</classBreaks>
	</gridPlot>
</gridPlotGroup>
|