What | TimeSeriesDisplayConfig.xml |
|---|---|
Config group | SystemConfigFiles |
Required | no |
Description | Configuration file for the time series display (line styles etc) |
schema location | http://fews.wldelft.nl/schemas/version1.0/timeSeriesDisplay.xsd |
| Table of Contents |
|---|
Introduction
The layout of the time series display is configured in an XML file in the System Configuration folder. When available on the file system, the name of the XML file is for example:
...
It is possible to display vertical lines in the slider bar in the spatial display that mark the start and/or end times of the displayed grid time series. These markers will only be visible when more than one grid is displayed, i.e. multiple data layers in one grid plot. In that case the start and/or end times can be different for each grid time series. These markers are configurable using the following marker options in the time markers display configuration:
- startTime
- endTime
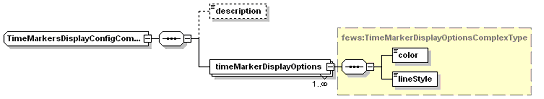
Figure 14 Elements in the TimeMarkersDisplay section of the TimeSeriesDisplay configuration
...
The preferred colour for the line and markers. This colour will only be used if it is not yet available in the current graph. If it is, then the next colour in the template order will be selected.
lineStyle
Line stype style of timeseries. Enumeration "solid", "none", "solid;thick", "bar", "dashed", "dashed;thick", "dotted", "dotted;thick", "dashdot", "dashdot;thick", "area", "constant", "verticalLine"
Line style "constant" applies to the scalar timeseries with only one value.
For this value a value marker (horizonal line) is created in the plot.
If the timeseries has more values, line style "constant" is ignored and the values are drawn with the line style "solid"
Line style "verticalLine" applies to scalar timeseries where the value will be ignored and a vertical line will be drawn at the time step in the plot with the comment written along with it if present. These vertical lines will be shown in all selected plots, there will not be a separate plot created for the "verticalLine" time series.
markerStyle
Marker style for markers plotted on the vertices of the line. Enumeration of "none", "+", "x", "circle", "square", "rectangle", "diamond", "triangleup" , "triangledown".
...