...

Figure 153 Root elements of the configuration display configuration.
inputTimeSerieInfo
TimeSeriesSet defined for the input data. This time series set is used when applying the correlation established to a complete hydrograph.
eventSetsDescriptorId
Id of the correlationEventSets to be used in the display. The event set must be defined in the CorrelationEventSetsDescriptors CorrelationEventSets configuration (See regional CorrelationEventSetsFiles\ Configuration).
travelTimesDescriptorId
Id of the travelTimesDescriptor travelTimes to be used in the display. The travel times set must be defined in the TravelTimesDescriptors travelTimes configuration (See regional TravelTimesFiles\ Configuration).
outputTimeSerieInfo
TimeSeriesSet defined for the output data. This time series set is used only for displaying the temporary time series to be displayed when applying the correlation established to a complete hydrograph. This time series is not saved in the database.
correlationDisplayOptions
Root element of options element for setting line colours in the scatter plot.
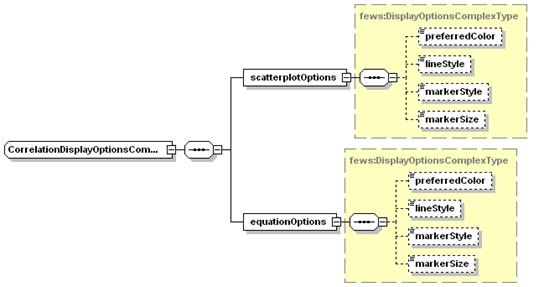
Figure 154 Elements of the scatterplot item in the CorrelationDisplay configuration
scatterplotOptions
Options for setting the properties of the scatter plot. The lineStyle of the scatter plot is "none" by definition (need not be defined).
equationOptions
Options for setting the properties of the regression line determined with the equation established.
preferredColor
Preferred colour for plotting scatter plot / regression line. For enumeration see timeSeriesDisplay Configuration in System Configuration.
markerStyle
Marker style for scatter plot / regression line. For enumeration see timeSeriesDisplay Configuration in System Configuration.
markerSize
Marker size for scatter plot / regression line in points.