| scrollbar |
|---|
| Anchor | ||||
|---|---|---|---|---|
|
| Anchor | ||||
|---|---|---|---|---|
|
...
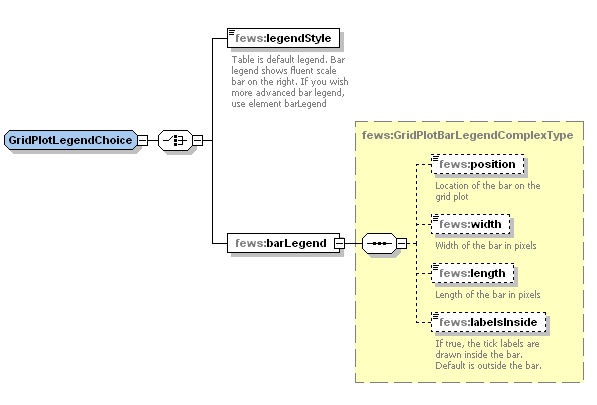
Elements of the configuration of legend style
valueTimeSeriesSet / directionTimeSeriesSet
If a timeseries with direction data is available, this is where the TimeSeriesSet should be placed. Note: a TimeSeriesSet with velocity values is required in the ValueTimeSeriesSet!
uTimeSeriesSet/vTimeSeriesSet
...
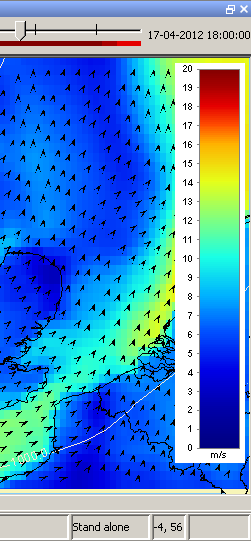
- Adding the uvAmplitudeParameterId element (since 2015.02), where an amplitude parameter can be configured, the timeseries display will combine the u and v timeseries into one amplitude timeseries (sqrt(u^2+v^2)).
- Adding the uvDirectionParameterId element (since 2016.01), where a wind direction parameter can be configured, the timeseries display will combine the u and v timeseries into one wind direction timeseries. The wind direction is in degrees, where the north direction is 360 degrees, east is 90 degrees, south is 180 degrees and west is 270 degrees.
DirectionTimeSeriesSet
...
uvAmplitudeParameterId (since 2015.02)
Id of a parameter that corresponds to the amplitude of this u,v data (e.g. wind speed). If this amplitude parameter is configured and the user double clicks on a grid cell in the grid display, then the TimeSeriesDialog will only display the amplitude sqrt(u^2+v^2) of this u,v data. The displayed amplitude time series uses the configured amplitude parameter. If neither the uvAmplitudeParameterId nor the uvDirectionParameterId is configured, then the TimeSeriesDialog only displays the separate u and v time series.
uvDirectionParameterId(since 2016.01)
Id of a parameter that corresponds to the direction of this u,v data (e.g. wind direction). If this direction parameter is configured and the user double clicks on a grid cell in the grid display, then the TimeSeriesDialog will only display the direction. The displayed wind direction time series uses the configured direction parameter. If neither the uvAmplitudeParameterId nor the uvDirectionParameterId is configured, then the TimeSeriesDialog displays the separate u and v time series.
uvDirectionParameterConvention (since 2016.02)
Configure the direction of arrows drawn in the grid display. Options are:
- to, typically used when displaying flow data or
- from, typically used when displaying wind data - this is the default option, which is used when nothing is configured.
sigmaScaleReferenceTimeSeriesSet (since 2017.02)
Additional timeserieset to link the sigma layers in a 3D model to indexed layers. For the location of the grid a sigma coordinate should be configured in the region config
verticalSliderRange (since 2017.02)
When a sigmaScaleReferenceTimeSeriesSet is configured, a vertical slider becomes automatically visible in GridDisplay to slide through the water column, displaying the 2D model results at a arbitrary water depth. The values displayed are dynamically interpolated between the sigma layers of the model, but only for the visible time step for performance reasons. The range of the slider is automatically adjusted to all available water depths for whole period, however you can limit this range using the <verticalSliderRange> option.
| Info | ||
|---|---|---|
| ||
The time slider ticks at the top of the gridDisplay are always colored are according to the top layer, even when a different depth is selected in the vertical slider. |
classBreaks
Definition of colours to use in displaying the dynamic grid. These are also shown in the legend on the left of the grid display (see example above). Optional when default class breaks are available for this plot group and parameter group. Note: the missingValueColor configured in this classBreaks element is also used to display missing values (NaN values) for point locations and tracks when the display is showing threshold warning level flags.
missingValueColor
: Color that is used to display missing values (NaN values) for point locations and tracks. Default is fully transparanttransparent.
missingValueOpaquenessPercentage
: Opaqueness percentage that is used to display missing values (NaN values) for point locations and tracks. This overrules the opaqueness of the configured missingValueColor. If missingValueOpaquenessPercentage is not configured, then opaqueness of missingValueColor is used.
...
Optional description. Since FEWS 2017.01 it is allowed to have multiple class breaks for a plot. The user can switch between the class breaks with a drop down list. This description is used in the drop down list.
missingValueColor
Not implemented yet.
missingValueOpaqueness
...