...
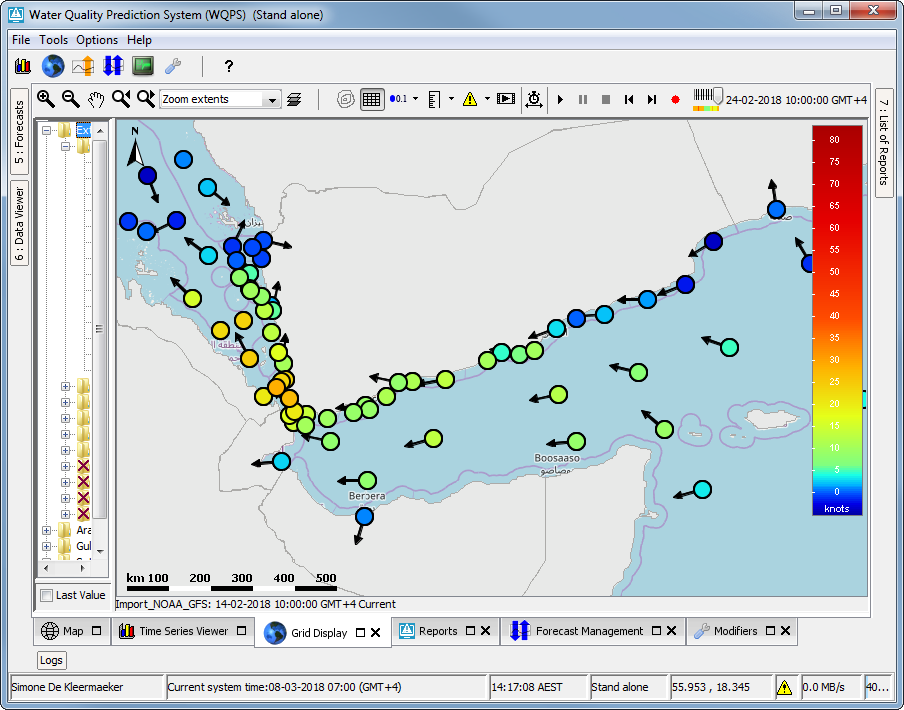
- timeSeriesSet: displayed as dots (see figure)
- uTimeSeriesSet and vTimeSeriesSet: displayed as arrows
- uTimeSeriesSet and vTimeSeriesSet, as well as a timeSeriesSet for the wind velocity for the same location(s): displayed as dots and arrows combined, resembling wind vanes (see figure)

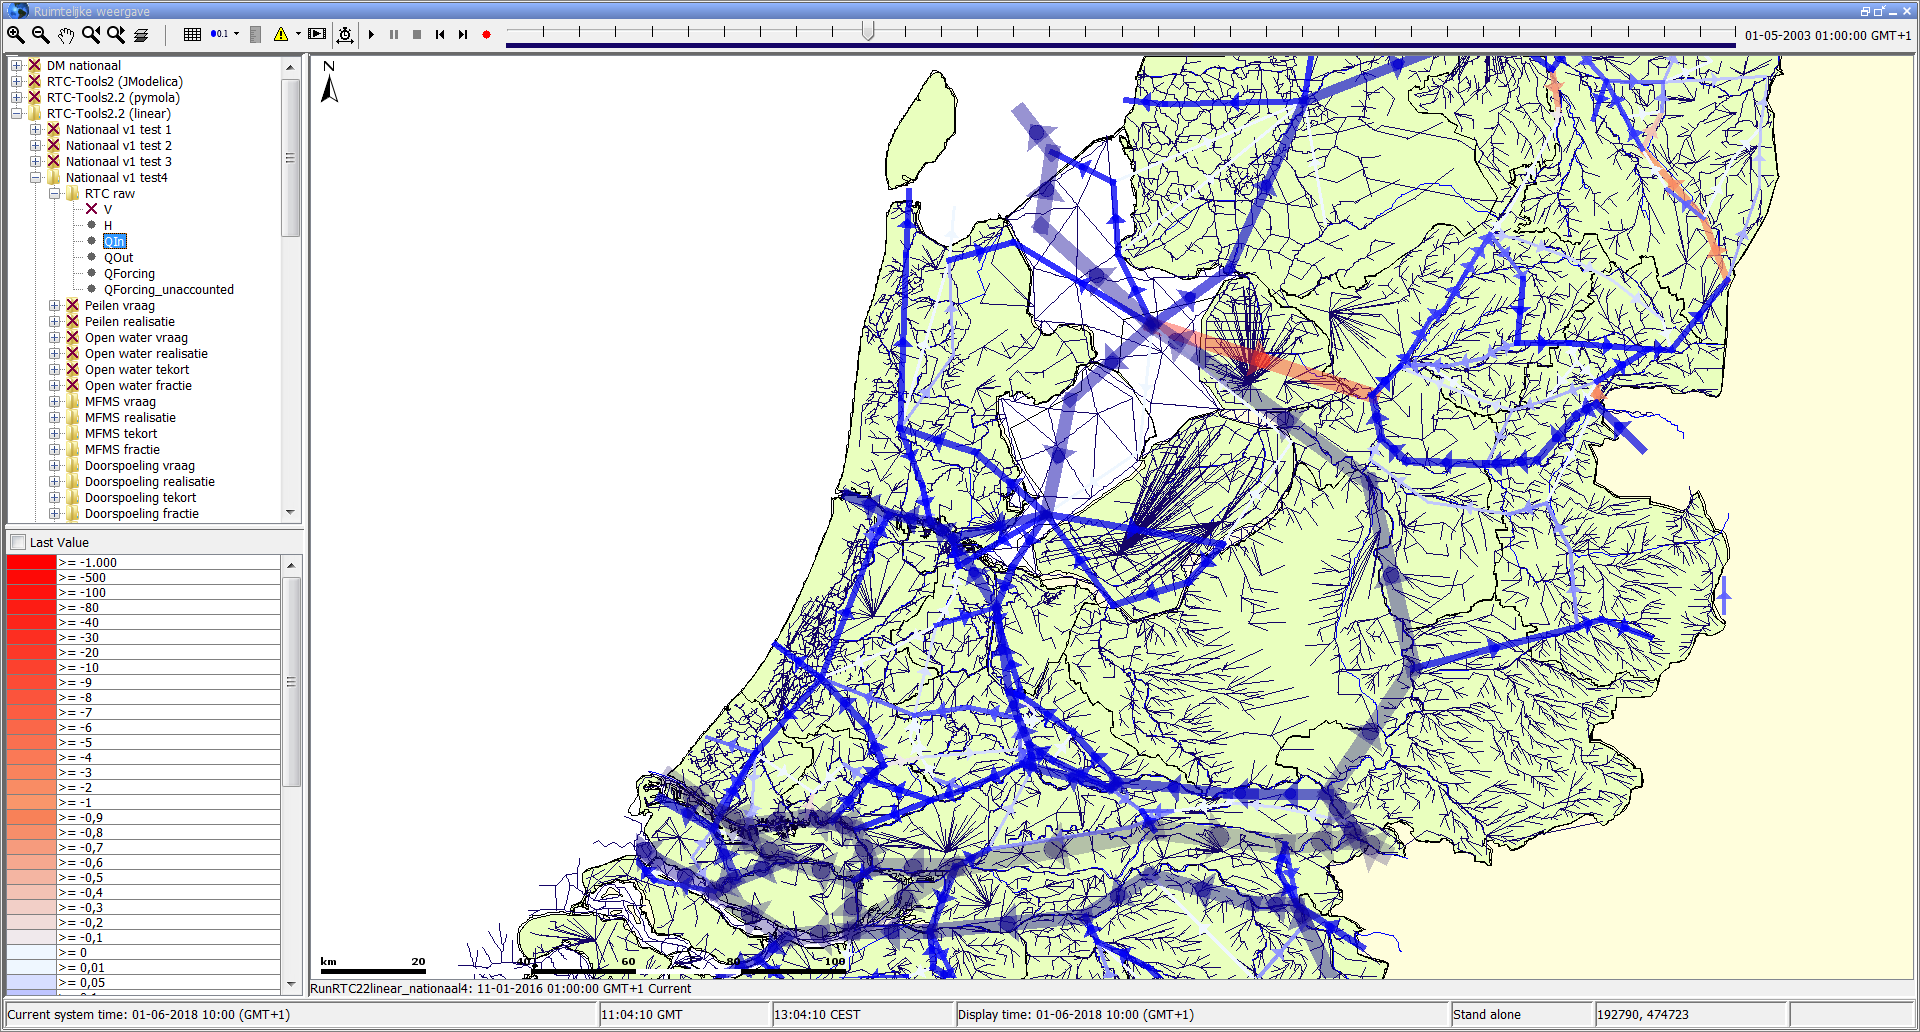
showArrowsOnLines
This element is available since 2018.01, in combination with a dataLayer containing a timeSeriesSet element. If this is set to true (false by default) and the grid geometry contains lines, the lines drawn in the spatial display will include directional arrows. If the time series has a positive value for a line, the arrow will point from the start of the line (first point found in the shape file) to the end of the line (second point found in the shape file). If the value is negative, the arrow is inverted. See the figures for examples.

showThumbnailsPanel
If this is true, then the grid display shows the spatial thumbnails panel when this grid plot is selected. Otherwise the grid display will not show the spatial thumbnails panel when this grid plot is selected. Default is false. After this grid plot has been selected, the user can still switch on/off the spatial thumbnails panel manually, using the toggle button in the grid display.
...