...
- description
- axisScaleUnit
- lowerMarginPercentage:
- upperMarginPercentage:
- barMarginPercentage: Since 2018.02. Only applicable for subplots which contain bars, such as plots of <subPlotType> "horizontalColorCode" or bar charts. Percentage of the bar width by which the bar width will be reduced, to create space between the bars. Default value is the barMarginPercentage in the generalDisplayConfig of the TimeSeriesDisplayConfig.xml (which is 0 by default). Use the general option to set a barMarginPercentage to be applied to all plots containing bars. Use this config option to overrule the general barMarginPercentage for a specific subplot.
- inverted
- plotweight
- plotSeparatorWeight
- thresholdAxisScaling
- forecastConfidenceTimeSpan: TimeSpanComplexType
- line
- area: Fills the area between multiple time series.
- color: Overides colours specified in the timeseriesdiplay
- lineStyle: Line style of time series marker line. Enumeration of "solid", "none", "bar", "dashdot", "dashed", "dotted". When a suffix of ";thick" is given, 1 will be added to the linewidth found in the TimeSeriesDisplayConfig.xml. For example, if a linewidth of 2 is configured in the TimeSeriesDisplayConfig and for a subplot the linestyle is set to "solid;thick", the resulting linewidth will be 2 + 1 = 3.
- timeSeriesSet
subPlotType
By default the <subPlotType> is set to 'standard', which means the default plot type for the configured timeSeriesType will be used. Optionally, you can configure the following other subplot types.
stack
Time series of this subplot are plotted as stacked areas (if lineStyle is solid) or stacked bars (if lineStyle is bar).
colorMapBars
Time series of this subplot are plotted as stacked bars. Color of the bar matches the paint scale color associated with the bar value. Height of all bars is the same, and equals Y-axis range / number of series in the plot.
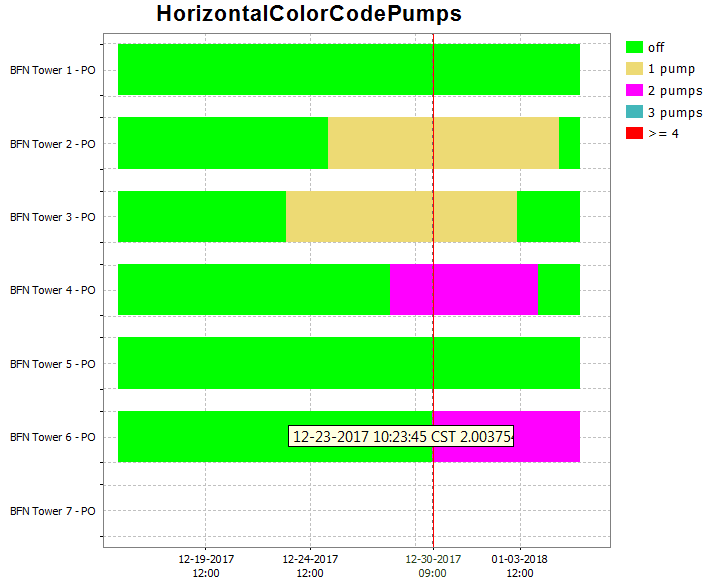
horizontalColorCode
A horizontal bar is plotted for each time series. The color of the bars signify the value for that time series at the given time on the x-axis.
|  |
|---|
Vertical line fill
Use the <area> element in combination with a <lineStyle> to obtain vertical lines.
...