| Anchor |
|---|
| _Toc154574472 |
|---|
| _Toc154574472 |
|---|
|
...
| Code Block |
|---|
| title | 3D data example for SpatialDisplay.xml |
|---|
|
<gridPlot id="3D_data" name="3D data display">
    <dataLayer>
        <arrowColor>white</arrowColor>
        <arrowSymbol>flow</arrowSymbol>
        <multipleArrowsPerValue>false</multipleArrowsPerValue>
        <uTimeSeriesSet>
            <moduleInstanceId>DFlowFM_FC</moduleInstanceId>
            <valueType>grid</valueType>
            <parameterId>C.simulated.u</parameterId>
            <locationSetId>DFlowFM_0_####</locationSetId>
            <timeSeriesType>simulated forecasting</timeSeriesType>
            <timeStep unit="nonequidistant"/>
            <readWriteMode>read complete forecast</readWriteMode>
        </uTimeSeriesSet>
        <vTimeSeriesSet>
            <moduleInstanceId>DFlowFM_FC</moduleInstanceId>
            <valueType>grid</valueType>
            <parameterId>C.simulated.v</parameterId>
            <locationSetId>DFlowFM_0_####</locationSetId>
            <timeSeriesType>simulated forecasting</timeSeriesType>
            <timeStep unit="nonequidistant"/>
            <readWriteMode>read complete forecast</readWriteMode>
        </vTimeSeriesSet>
        <uvAmplitudeParameterId>C.simulated.speed</uvAmplitudeParameterId>
        <uvDirectionParameterId>C.simulated.dir</uvDirectionParameterId>
        <sigmaScaleReferenceTimeSeriesSet>
            <moduleInstanceId>DFlowFM_FC</moduleInstanceId>
            <valueType>grid</valueType>
            <parameterId>WD.simulated</parameterId>
            <locationSetId>DFlowFM.merged</locationSetId>
            <timeSeriesType>simulated forecasting</timeSeriesType>
            <timeStep unit="nonequidistant"/>
            <readWriteMode>read complete forecast</readWriteMode>
        </sigmaScaleReferenceTimeSeriesSet>
    </dataLayer>

    <barLegend>
        <position>right</position>
        <width>50</width>
        <length>400</length>
        <labelsInside>true</labelsInside>
    </barLegend>
    <classBreaksId>Class.Currents</classBreaksId>
    <contourLinesColor>antique white</contourLinesColor>
</gridPlot>
|
ClassBreak labels
If label is configured in a classbreak, the legend will show the label in the table instead of the values. When a mouse is hovering over a point, the tooltip will show the configured value if there is no label, and the label plus the value if there is a label (since 2018.02.). Notice in the example bellow that one of the breaks has no label. Image Added
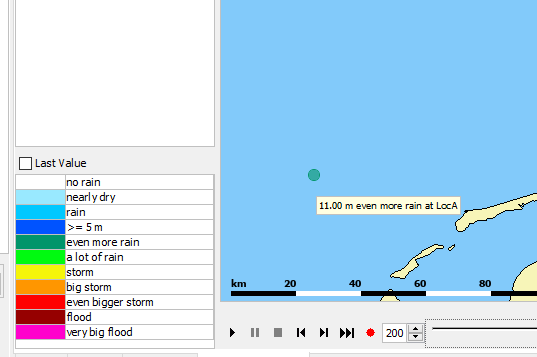 Image Added
| Code Block |
|---|
| language | xml |
|---|
| linenumbers | true |
|---|
|
<gridPlotGroup id="PlotGroup1">
   <gridPlot id="PlotGroup1 Plot1">
      <dataLayer>
            <timeSeriesSet>
               <moduleInstanceId>Import</moduleInstanceId>
               <valueType>scalar</valueType>
               <parameterId>H.m</parameterId>
               <locationId>LocA</locationId>
               <timeSeriesType>external historical</timeSeriesType>
               <timeStep unit="hour"/>
               <relativeViewPeriod unit="hour" start="-24" end="0"/>
               <readWriteMode>read only</readWriteMode>
         </timeSeriesSet>
      </dataLayer>
      <classBreaks>
         <unitVisible>true</unitVisible>
         <break color="FFFFFF" lowerValue="0" label="no rain" opaquenessPercentage="35"/>
         <break color="99E9FF" lowerValue="0.2" label="nearly dry" opaquenessPercentage="35"/>
         <break color="00C8FF" lowerValue="1" label="rain" opaquenessPercentage="60"/>
         <break color="0053FF" lowerValue="5" opaquenessPercentage="60"/>
         <break color="00956A" lowerValue="10" label="even more rain" opaquenessPercentage="60"/>
         <break color="00FA10" lowerValue="25" label="a lot of rain" opaquenessPercentage="60"/>
         <break color="F5F50A" lowerValue="50" label="storm" opaquenessPercentage="60"/>
         <break color="FF9600" lowerValue="75" label="big storm" opaquenessPercentage="60"/>
         <break color="FF0000" lowerValue="100" label="even bigger storm" opaquenessPercentage="80"/>
         <break color="960000" lowerValue="200" label="flood" opaquenessPercentage="80"/>
         <break color="FF00CC" lowerValue="400" label="very big flood" opaquenessPercentage="80"/>
      </classBreaks>
   </gridPlot>
</gridPlotGroup>
|
Logo at map
Some satelite products require to be shown with a logo, where the imageFile with the logo should be located in the MaplayerFiles directory.
...