...
| Code Block | ||||
|---|---|---|---|---|
| ||||
<gridPlotGroup id="PlotGroup1">
   <gridPlot id="PlotGroup1 Plot1">
      <dataLayer>
            <timeSeriesSet>
               <moduleInstanceId>Import</moduleInstanceId>
               <valueType>scalar</valueType>
               <parameterId>H.m</parameterId>
               <locationId>LocA</locationId>
               <timeSeriesType>external historical</timeSeriesType>
               <timeStep unit="hour"/>
               <relativeViewPeriod unit="hour" start="-24" end="0"/>
               <readWriteMode>read only</readWriteMode>
         </timeSeriesSet>
      </dataLayer>
      <classBreaks>
         <unitVisible>true</unitVisible>
         <break color="FFFFFF" lowerValue="0" label="no rain" opaquenessPercentage="35"/>
         <break color="99E9FF" lowerValue="0.2" label="nearly dry" opaquenessPercentage="35"/>
         <break color="00C8FF" lowerValue="1" label="rain" opaquenessPercentage="60"/>
         <break color="0053FF" lowerValue="5" opaquenessPercentage="60"/>
         <break color="00956A" lowerValue="10" label="even more rain" opaquenessPercentage="60"/>
         <break color="00FA10" lowerValue="25" label="a lot of rain" opaquenessPercentage="60"/>
         <break color="F5F50A" lowerValue="50" label="storm" opaquenessPercentage="60"/>
         <break color="FF9600" lowerValue="75" label="big storm" opaquenessPercentage="60"/>
         <break color="FF0000" lowerValue="100" label="even bigger storm" opaquenessPercentage="80"/>
         <break color="960000" lowerValue="200" label="flood" opaquenessPercentage="80"/>
         <break color="FF00CC" lowerValue="400" label="very big flood" opaquenessPercentage="80"/>
      </classBreaks>
   </gridPlot>
</gridPlotGroup>
|
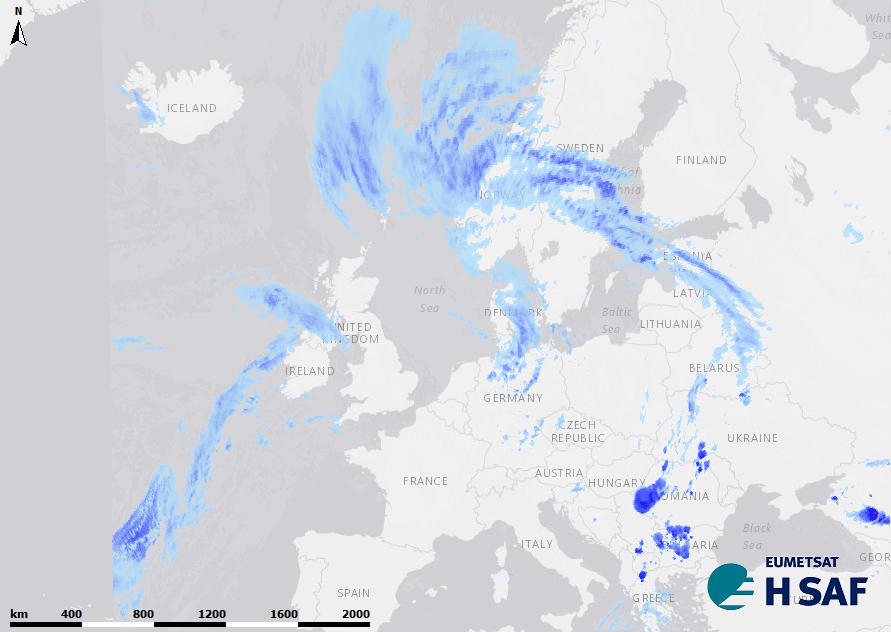
Logo at map
Some satelite products require to be shown with a logo, where the imageFile with the logo should be located in the MaplayerFiles directory.
...
| Code Block | ||||
|---|---|---|---|---|
| ||||
<gridPlot id="Precipitation"> <timeSeriesSet> <moduleInstanceId>Import_NWP</moduleInstanceId> <valueType>grid</valueType> <parameterId>P.fc</parameterId> <qualifierId>aladin_hr</qualifierId> <locationId>NWP_ALADIN_HR</locationId> <timeSeriesType>external forecasting</timeSeriesType> <timeStep unit="hour"/> <relativeViewPeriod unit="day" start="-5" end="10"/> <readWriteMode>read only</readWriteMode> </timeSeriesSet> <logo> <imageFile>logo.png</imageFile> <position>topRight</position> </logo> <classBreaksId>Precipitation_1h</classBreaksId> <contourLinesColor>gray</contourLinesColor> </gridPlot> |
Showing T0 or last import time underneath plot
work in progress