...
Break also has the attribute hideValueLabel. Default is false, if it is set to true, labels of values that fall into this classbreak will not be displayed. See example below. This is available since 2020.01.
| Code Block |
|---|
| language | xml |
|---|
| linenumbers | true |
|---|
|
<classBreaks>
		<break color="white" label="0 mg/L" opaquenessPercentage="30" lowerValue="0" colorSmoothingEnabled="true" hideValueLabels="true"/>
		<color color="070268" label="10 mg/L" lowerValue="10" colorSmoothingEnabled="true"/>
</classBreaks> |
...
| Code Block |
|---|
|
<panelSizes>
	<loggingPanelSize>0</loggingPanelSize>
	<listsPanelSize>22</listsPanelSize>
	<filterListSize>38</filterListSize>
	<locationListSize>45</locationListSize>
	<parameterListSize>19</parameterListSize>
	<forecastListSize>20</forecastListSize>
</panelSizes>
|


The classbreaks (legend) for the absolute and relative difference are automatically calculated based on the default classbreaks for the plot. However you can configure these two classbreaks yourself the absoluteDifferenceClassBreaksId and relativeDifferenceClassBreaksId. You can configure both or one of them.
| Code Block |
|---|
|
<defaults>
   <plotId>Meteo - Air Temperature</plotId>
   <absoluteDifferenceClassBreaksId>abs_id</absoluteDifferenceClassBreaksId>
   <relativeDifferenceClassBreaksId>relative_Id</relativeDifferenceClassBreaksId>
|
Split Grids.xml file in multiple config files with gridPlotGroups (Since 2019.02)
...
| Code Block |
|---|
| language | xml |
|---|
| title | Config file using gridDisplayGroups.xsd |
|---|
|
<?xml version="1.0" encoding="UTF-8"?>
<gridPlotGroups xmlns="http://www.wldelft.nl/fews" xmlns:xsi="http://www.w3.org/2001/XMLSchema-instance"
					   xsi:schemaLocation="http://www.wldelft.nl/fews  http://fews.wldelft.nl/schemas/version1.0/gridPlotGroups.xsd">
	<gridPlotGroup id="DFlow-FM" name="DFlow-FM">
		<gridPlot id="Observed" name="Observed2">
			<timeSeriesSet>
				<moduleInstanceId>Import_Telemetry</moduleInstanceId>
				<valueType>grid</valueType>
				<parameterId>P.obs</parameterId>
				<locationId>Delft3DFM_PROI1</locationId>
				<timeSeriesType>external historical</timeSeriesType>
				<timeStep unit="hour"/>
				<relativeViewPeriod unit="hour" start="-96" end="48"/>
				<readWriteMode>read only</readWriteMode>
			</timeSeriesSet>
		</gridPlot>
		<gridPlot id="Forecast" name="Forecast">
			<timeSeriesSet>
				<moduleInstanceId>Import_Telemetry</moduleInstanceId>
				<valueType>grid</valueType>
				<parameterId>P.obs</parameterId>
				<locationId>Delft3DFM_PROI1</locationId>
				<timeSeriesType>external historical</timeSeriesType>
				<timeStep unit="hour"/>
				<relativeViewPeriod unit="hour" start="-96" end="48"/>
				<readWriteMode>read only</readWriteMode>
			</timeSeriesSet>
		</gridPlot>
	</gridPlotGroup>
</gridPlotGroups>
|
| Code Block |
|---|
xml| language | xml | | title | Extract of SpatialDisplay.xml |
|---|
|
<?xml version="1.0" encoding="UTF-8"?>
<gridDisplay xmlns="http://www.wldelft.nl/fews" xmlns:xsi="http://www.w3.org/2001/XMLSchema-instance" xsi:schemaLocation="http://www.wldelft.nl/fews  http://fews.wldelft.nl/schemas/version1.0/gridDisplay.xsd">
......
	<gridPlotGroupId>DFlow-FM</gridPlotGroupId>
</gridDisplay>
|
...
The following example shows how to configure a Meteosat image as grayScaleImage in the Grid display.
| Code Block |
|---|
xml| language | xml | | title | Extract of SpatialDisplay.xml |
|---|
|
<gridPlotGroup id="Meteosat Images">
	<gridPlot id="MeteoSat">
		<timeSeriesSet>
			<moduleInstanceId>ImportMeteosat</moduleInstanceId>
			<valueType>grid</valueType>
			<parameterId>image</parameterId>
			<locationId>meteosat</locationId>
			<timeSeriesType>external historical</timeSeriesType>
			<timeStep unit="minute" multiplier="15"/>
			<relativeViewPeriod unit="hour" start="-12" end="36"/>
			<readWriteMode>read only</readWriteMode>
		</timeSeriesSet>
		<classBreaks>
			<lowerColor>black</lowerColor>
			<upperColor>white</upperColor>
			<lowerValue>0</lowerValue>
			<lowerValue>8</lowerValue>
			<lowerValue>16</lowerValue>
			<lowerValue>24</lowerValue>
			<lowerValue>32</lowerValue>
			<lowerValue>40</lowerValue>
			<lowerValue>48</lowerValue>
			<lowerValue>56</lowerValue>
			<lowerValue>64</lowerValue>
			<lowerValue>72</lowerValue>
			<lowerValue>80</lowerValue>
			<lowerValue>88</lowerValue>
			<lowerValue>96</lowerValue>
			<lowerValue>104</lowerValue>
			<lowerValue>112</lowerValue>
			<lowerValue>120</lowerValue>
			<lowerValue>128</lowerValue>
			<lowerValue>136</lowerValue>
			<lowerValue>144</lowerValue>
			<lowerValue>152</lowerValue>
			<lowerValue>160</lowerValue>
			<lowerValue>168</lowerValue>
			<lowerValue>176</lowerValue>
			<lowerValue>184</lowerValue>
			<lowerValue>192</lowerValue>
			<lowerValue>200</lowerValue>
			<lowerValue>208</lowerValue>
			<lowerValue>216</lowerValue>
			<lowerValue>224</lowerValue>
			<lowerValue>232</lowerValue>
			<lowerColor>orange</lowerColor>
			<upperColor>red</upperColor>
			<lowerValue>240</lowerValue>
			<lowerValue>248</lowerValue>
			<lowerValue>255</lowerValue>
		</classBreaks>
	</gridPlot>
</gridPlotGroup>
|
...
The following example shows how to configure 3D data originating from several computational domains in the Grid display.
| Code Block |
|---|
| language | xml |
|---|
| title | 3D data example for SpatialDisplay.xml |
|---|
|
<gridPlot id="3D_data" name="3D data display">
    <dataLayer>
        <arrowColor>white</arrowColor>
        <arrowSymbol>flow</arrowSymbol>
        <multipleArrowsPerValue>false</multipleArrowsPerValue>
        <uTimeSeriesSet>
            <moduleInstanceId>DFlowFM_FC</moduleInstanceId>
            <valueType>grid</valueType>
            <parameterId>C.simulated.u</parameterId>
            <locationSetId>DFlowFM_0_####</locationSetId>
            <timeSeriesType>simulated forecasting</timeSeriesType>
            <timeStep unit="nonequidistant"/>
            <readWriteMode>read complete forecast</readWriteMode>
        </uTimeSeriesSet>
        <vTimeSeriesSet>
            <moduleInstanceId>DFlowFM_FC</moduleInstanceId>
            <valueType>grid</valueType>
            <parameterId>C.simulated.v</parameterId>
            <locationSetId>DFlowFM_0_####</locationSetId>
            <timeSeriesType>simulated forecasting</timeSeriesType>
            <timeStep unit="nonequidistant"/>
            <readWriteMode>read complete forecast</readWriteMode>
        </vTimeSeriesSet>
        <uvAmplitudeParameterId>C.simulated.speed</uvAmplitudeParameterId>
        <uvDirectionParameterId>C.simulated.dir</uvDirectionParameterId>
        <sigmaScaleReferenceTimeSeriesSet>
            <moduleInstanceId>DFlowFM_FC</moduleInstanceId>
            <valueType>grid</valueType>
            <parameterId>WD.simulated</parameterId>
            <locationSetId>DFlowFM.merged</locationSetId>
            <timeSeriesType>simulated forecasting</timeSeriesType>
            <timeStep unit="nonequidistant"/>
            <readWriteMode>read complete forecast</readWriteMode>
        </sigmaScaleReferenceTimeSeriesSet>
    </dataLayer>

    <barLegend>
        <position>right</position>
        <width>50</width>
        <length>400</length>
        <labelsInside>true</labelsInside>
    </barLegend>
    <classBreaksId>Class.Currents</classBreaksId>
    <contourLinesColor>antique white</contourLinesColor>
</gridPlot>
|
...
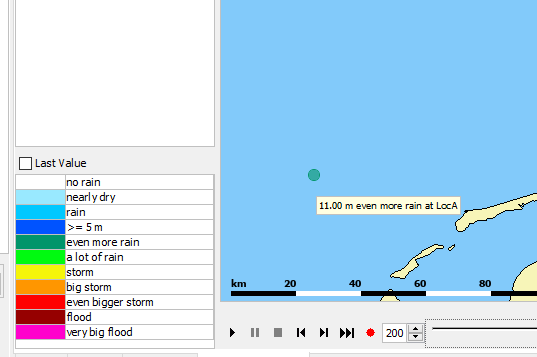
If label is configured in a classbreak, the legend will show the label in the table instead of the values. When a mouse is hovering over a point, the tooltip will show the configured value if there is no label, and the label plus the value if there is a label (since 2018.02.). Notice in the example below that one of the breaks has no label.

| Code Block |
|---|
| language | xml |
|---|
| linenumbers | true |
|---|
|
<gridPlotGroup id="PlotGroup1">
   <gridPlot id="PlotGroup1 Plot1">
      <dataLayer>
            <timeSeriesSet>
               <moduleInstanceId>Import</moduleInstanceId>
               <valueType>scalar</valueType>
               <parameterId>H.m</parameterId>
               <locationId>LocA</locationId>
               <timeSeriesType>external historical</timeSeriesType>
               <timeStep unit="hour"/>
               <relativeViewPeriod unit="hour" start="-24" end="0"/>
               <readWriteMode>read only</readWriteMode>
         </timeSeriesSet>
      </dataLayer>
      <classBreaks>
         <unitVisible>true</unitVisible>
         <break color="FFFFFF" lowerValue="0" label="no rain" opaquenessPercentage="35"/>
         <break color="99E9FF" lowerValue="0.2" label="nearly dry" opaquenessPercentage="35"/>
         <break color="00C8FF" lowerValue="1" label="rain" opaquenessPercentage="60"/>
         <break color="0053FF" lowerValue="5" opaquenessPercentage="60"/>
         <break color="00956A" lowerValue="10" label="even more rain" opaquenessPercentage="60"/>
         <break color="00FA10" lowerValue="25" label="a lot of rain" opaquenessPercentage="60"/>
         <break color="F5F50A" lowerValue="50" label="storm" opaquenessPercentage="60"/>
         <break color="FF9600" lowerValue="75" label="big storm" opaquenessPercentage="60"/>
         <break color="FF0000" lowerValue="100" label="even bigger storm" opaquenessPercentage="80"/>
         <break color="960000" lowerValue="200" label="flood" opaquenessPercentage="80"/>
         <break color="FF00CC" lowerValue="400" label="very big flood" opaquenessPercentage="80"/>
      </classBreaks>
   </gridPlot>
</gridPlotGroup>
|
Show last import time for external historical data
This option is supporten supported with online version only. The option dataFeedId needs to be configured per gridPlot. The value of the dataFeedId must be the same value that can be seen in System Monitor table, tab Import Status. The id should be the one that corresponds with the module instance id of the time series.
| Code Block |
|---|
| language | xml | linenumbers | true |
|---|
|
<gridPlotGroup id="Radar KNMI">
   <gridPlot id="TF0005_R" name="Uncorrected 5 min">
      <dataFeedId>ATIS</dataFeedId>
      <timeSeriesSet>
         <moduleInstanceId>ImportWIWB</moduleInstanceId>
         <valueType>grid</valueType>
         <parameterId>P.radar</parameterId>
         <qualifierId>realtime</qualifierId>
         <locationId>KNMI-RADAR1km</locationId>
         <timeSeriesType>external historical</timeSeriesType>
         <timeStep unit="minute" multiplier="5"/>
         <relativeViewPeriod unit="day" start="-10" end="5"/>
         <readWriteMode>read only</readWriteMode>
      </timeSeriesSet>
      <accumulationTimeSpan multiplier="1" unit="hour"/>
      <accumulationTimeSpan multiplier="6" unit="hour"/>
      <accumulationTimeSpan multiplier="12" unit="hour"/>
      <classBreaks>
         <break lowerValue="0" color="white" label="0 mm/hr" opaquenessPercentage="25"/>
         <break lowerValue="0.008" color="light blue" label="0.1" opaquenessPercentage="75"/>
         <break lowerValue="0.083" color="8CAAFF" label="1" opaquenessPercentage="80"/>
         <break lowerValue="0.167" color="636DFF" label="2" opaquenessPercentage="85"/>
      </classBreaks>
      <contourLinesColor>gray</contourLinesColor>
   </gridPlot>
</gridPlotGroup> |
...