What | TimeSeriesDisplayConfig.xml |
|---|---|
Config group | SystemConfigFiles |
Required | no |
Description | Configuration file for the time series display (line styles etc) |
schema location | http://fews.wldelft.nl/schemas/version1.0/timeSeriesDisplay.xsd |
...
- systemTime
- displayTime: time that can be set with the display time button (clock icon) in the time series dialog, by default equals the system time
- timeZero: T0 of the external forecast time series
- forecastStartTime (since stable build 2014.01). This will show vertical lines in charts for the start times of forecast time series, i.e. time series of type external forecasting, simulated forecasting. It will only be shown when the forecast time series is configured with "read complete forecast" as readWriteMode.
- threshold
- zeroBaseline
timeOfValidity (since 2016.01). This marker should be visualized in the display when the Tv button is activated. This will show vertical lines in charts placed at the Time of Validity (Tv) of that display node. The Tv is determined using the timeOfValiditySearchPeriod. The functionality of Time of Validity is more exhaustively described in the Validation Status page.Anchor timeSeriesDisplayConfig_TimeMarkersDisplayConfiguration timeSeriesDisplayConfig_TimeMarkersDisplayConfiguration
The following marker options can be used to display forecast confidence time spans in the time series display. Up to three forecast confidence time spans can be defined for each sub plot in the displayGroups configuration file.
...
It is possible to display vertical lines in the slider bar in the spatial display that mark the start and/or end times of the displayed grid time series. These markers will only be visible when more than one grid is displayed, i.e. multiple data layers in one grid plot. In that case the start and/or end times can be different for each grid time series. These markers are configurable using the following marker options in the time markers display configuration:
- startTime
- endTime
...
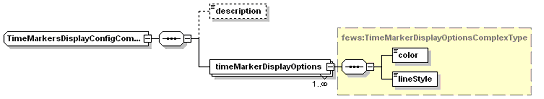
Figure 14 Elements in the TimeMarkersDisplay section of the TimeSeriesDisplay configuration
...
The example config below can be used to produce a graph with custom direction icons (displayed on the left in the image above). Removing the <markerIcon> element will result in the default arrow icons being used (displayed on the right in the image above).
| Code Block | ||||
|---|---|---|---|---|
| ||||
<parameterDisplayOptions id="WindSpeed"> <preferredColor>purple</preferredColor> <lineStyle>solid</lineStyle> <markerRotationParameterId>WindDirection</markerRotationParameterId> <markerIcon>arrow_icon.png</markerIcon> <markerRotationOffset>180</markerRotationOffset> </parameterDisplayOptions> |
...
- function: historicalAnalysis
- historicalPeriods: Definition of season as well as the moment when the display should look forward instead of backward to plot the coming season
| Code Block | ||||
|---|---|---|---|---|
| ||||
   <historicalPeriods>
    <historicalPeriod>
     <startForwardLookingPeriod>--04-01</startForwardLookingPeriod>
     <season startMonthDay="--04-01" endMonthDay="--10-01" label="zomer"/>
    </historicalPeriod>
</historicalPeriods> |
...
- function: historicalScatterPlot
- season: Definition of seasons
| Code Block | ||||
|---|---|---|---|---|
| ||||
<statisticalFunction function="historicalShowPeaksAbove"> <season startMonthDay="--01-01" endMonthDay="--12-31" label="Year" color="black"/> <season startMonthDay="--04-01" endMonthDay="--09-30" label="Grow Season" color="gray"/> </statisticalFunction> |
...
- function: normalizedFlow
- label: caption used in function selection
- ignoreMissings: when true, missing values are ignored and each average will be calculated from the available values within the current time window.
When false, calculated values will be set to missing if one or more values within the current time window are missing. - areaFunction: attribute aware function to transfer input parameter series
- parameterId: parameter used for unit in display
- allowedInputParameterId: series to be converted using area function
| Code Block | ||||
|---|---|---|---|---|
| ||||
<statisticalFunction function="normalizedFlow" label="Flow (mm/day)" ignoreMissings="true"> <areaFunction>@AREA_HA@*10/86400</areaFunction> <parameterId>Q.mmd</parameterId> <allowedInputParameterId>Q.obs</allowedInputParameterId> </statisticalFunction> |
...
- function: principalcomponentanalysis
- observedParameterId: parameter referencing the independent (observed) series
- simulatedParameterId: parameter referencing the dependent (simulated) series
- dateFormat: optional
| Code Block | ||
|---|---|---|
| ||
<statisticalFunction function="principalcomponentanalysis"> <observedParameterId>SWE.m</observedParameterId> <simulatedParameterId>SWE.sim</simulatedParameterId> <dateFormat>MM-dd-yyyy</dateFormat> </statisticalFunction> |
...
- function: showPeaksAbove
- label: label used in the combobox to select a statistical function (since 2015.01).
Subelements:
- season (since 2015.01): one ore more color seasons can be configured with a color that will be used to display a point if the time of the show peaks above plot point is in that period. Periods should NOT be overlapping.
...
| Code Block | ||||
|---|---|---|---|---|
| ||||
<resampling> <timeStep label="minute" unit="minute"/> <timeStep label="5 minutes" unit="minute" multiplier="5"/> <timeStep label="10 minutes" unit="minute" multiplier="10"/> <timeStep label="15 minutes" unit="minute" multiplier="15"/> <timeStep label="30 minutes" unit="minute" multiplier="30"/> <timeStep label="hour" unit="hour"/> <timeStep label="2 hour" unit="hour" multiplier="2"/> <timeStep label="3 hour" unit="hour" multiplier="3"/> <timeStep label="6 hour" unit="hour" multiplier="6"/> <timeStep label="12 hour" unit="hour" multiplier="12"/> <timeStep label="day" unit="day"/> <timeStep label="week" unit="week"/> <timeStep label="month" unit="month"/> <timeStep label="year" unit="year"/> </resampling> |
...