...
Below is an overview of the options that are available in the schematic status display xml schema. All configuration options are also documented in the annotations in the schematic status display xml schema. To get the most up to date information about the available configuration options and their documentation in the annotations, please consult the schematic status display xml schema, which is available here.

Scada display configuration elements
...
Time Navigator Toolbar Configuration Options
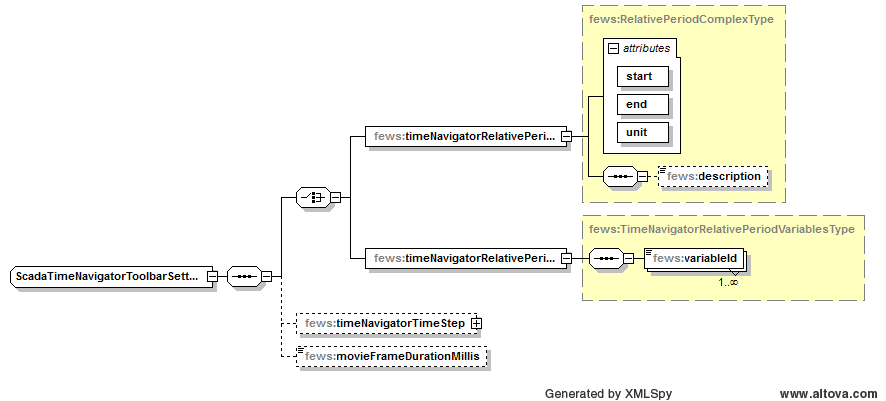
Time navigator toolbar configuration elements
...
Scada Panel Configuration Options

Schematic status panel configuration elements
...
Optional. Identifier that refers to a node in the topology configuration file. If specified, then the referenced topology node will be selected when this scadaPanel is selected in the user interface. When the topology node is selected, then that may cause other things to be selected as well, like e.g. the displayGroup in the TimeSeriesDisplay that corresponds to that node.
backgroundColor
Optional configuration for the background color of a specific panel. If no color is configured, the background color that is configured for the scada display will apply.
...
One or more items to define special behaviour and/or properties for text components in this schematic status panel. Each item refers to an svg object that is defined in the given svg file. Each item also contains definitions of behaviour and/or properties for that object. This way it is possible to e.g. replace tags in the text of a text object with certain values from a certain time series, or to define what should happen when the user clicks on a certain component.
...
One or more items to define special behaviour and/or properties for shape components in this schematic status panel. Each item refers to an svg object that is defined in the given svg file. Each item also contains definitions of behaviour and/or properties for that object. This way it is possible to e.g. replace tags in the text of a text object with certain values from a certain time series, or to define what should happen when the user clicks on a certain component.
Definition of special behaviour and/or properties for a shape component in this schematic status panel. This refers to an svg object of type "shape" that is defined in the given svg file. This contains definitions of behaviour and/or properties for that svg object. An svg object of type "shape" can be a "path", "rect", "circle", "ellipse", "line", "polyline" or "polygon" element.definitions of behaviour and/or properties for that svg object. An svg object of type "shape" can be a "path", "rect", "circle", "ellipse", "line", "polyline" or "polygon" element.
chartComponentBehaviourDefinition
One or more items to define special behaviour and/or properties for chart components in this schematic status panel. Each item refers to an svg object that is defined in the given svg file. Each item also contains definitions of behaviour and/or properties for that object. This way it is possible to insert timeseries charts defined in the DisplayGroups configuration. Such charts are implicitly linked to a leftSingleClickAction that opens the same chart in a new Timeseries Display window.
Charts are rendered as SVG <image> elements for embedding them in a schematic status panel, a practical problem with this is that empty <image> elements in a SVG file are considered in error and SVG editors (i.e. InkScape) that typically are used to prepare the SVG files will not allow you to insert <image> elements without an actual image attached. Therefore any shape element (<rect> is recommend) that has width and height properties can be used as a placeholder, that will be replaced by an image as the SVG file is processed.
svgObjectId
The id of the object in the svg file for which this item defines special behaviour and/or properties.
...
Left Single Click Action and Left Double Click Action Configuration Options
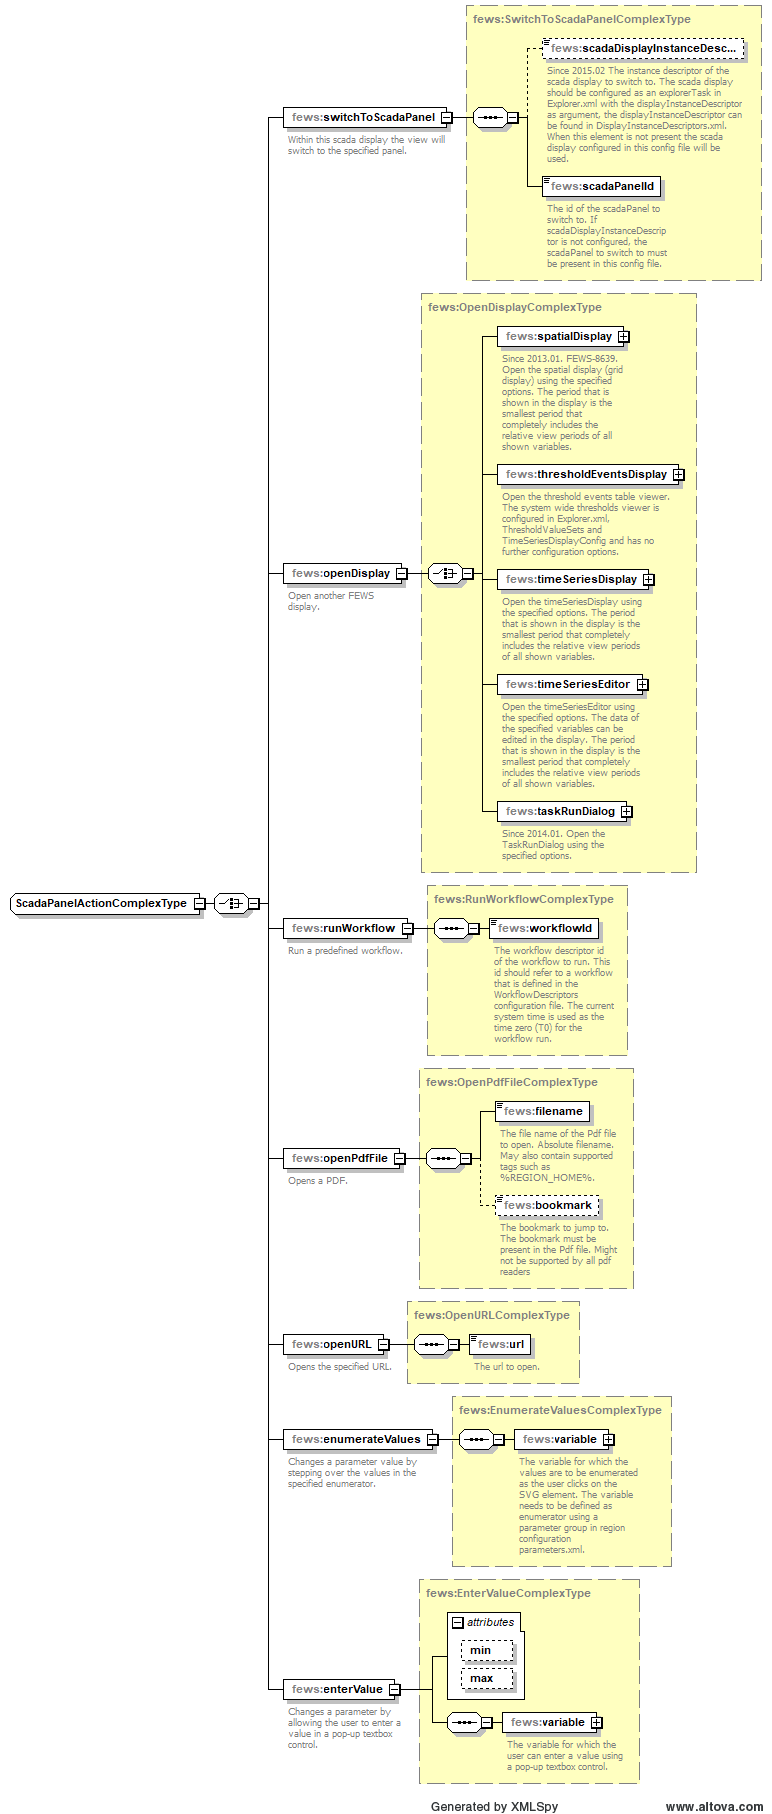
Click action configuration elements
...
Link Properties To Data Configuration Options
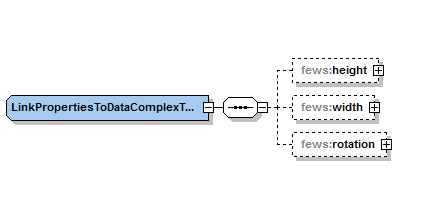
Link properties to data configuration elements
...
Link Height To Data Configuration Options

Link height to data configuration elements
...
Link Width To Data Configuration Options

Link width to data configuration elements
...
Link Rotation To Data Configuration Options
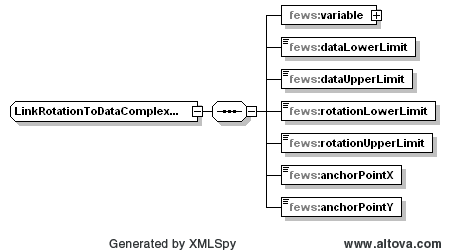
Link rotation to data configuration elements
...
Use Threshold Warning Level Colors Configuration Options
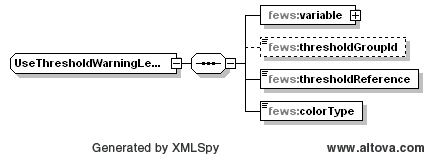
Use threshold warning level colors configuration elements
...
Use Threshold Warning Level Symbols Configuration Options

The fields in this xml configuration are the same as for the threshold warning level colors described above, except that the fews:colortype field is not applicable here.
...
Tooltip Configuration Options
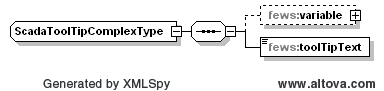
Tooltip configuration elements
...
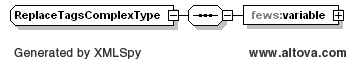
Replace Tags Configuration Options
| Anchor | ||||
|---|---|---|---|---|
|
If specified, then the tags in the text of this component are replaced using data from the specified variable. Tags should be separated by "%" signs. Text can be e.g. "Last value = %LASTVALUE(numberFormatId)%", which would be replaced by e.g. "Last value = 10.0". The following tags can be used in the text (numberFormatId/dateFormatId should be replaced by the id of a numberFormat/dateFormat that is defined at the start of this configuration file):
...
Variable Configuration Options
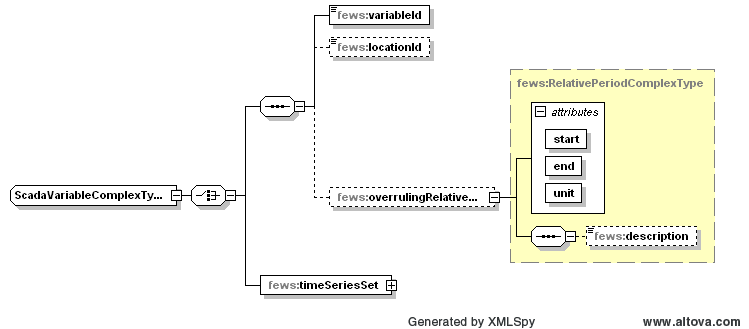
Variable configuration elements
...
| Code Block | ||||
|---|---|---|---|---|
| ||||
<variable> <variableId>Observation</variableId> <timeSeriesSet> <moduleInstanceId>Afgeleide_Twentekanalen</moduleInstanceId> <valueType>scalar</valueType> <parameterId>H.meting</parameterId> <locationSetId>Hydro_LMW_TK_H</locationSetId> <timeSeriesType>external historical</timeSeriesType> <timeStep unit="hour"/> <relativeViewPeriod unit="hour" start="-1" end="0"/> <readWriteMode>read only</readWriteMode> </timeSeriesSet> </variable> <variable> <variableId>Correction</variableId> <timeSeriesSet> <moduleInstanceId>Afgeleide_Twentekanalen</moduleInstanceId> <valueType>scalar</valueType> <parameterId>H.meting</parameterId> <locationSetId>Hydro_LMW_TK_H</locationSetId> <timeSeriesType>external historical</timeSeriesType> <timeStep unit="hour"/> <relativeViewPeriod unit="hour" start="-1" end="0"/> <readWriteMode>read only</readWriteMode> </timeSeriesSet> </variable> <variable> <variableId>Observation_minus_correction</variableId> <timeSeriesSet> <moduleInstanceId>Afgeleide_Twentekanalen</moduleInstanceId> <valueType>scalar</valueType> <parameterId>H.meting</parameterId> <locationSetId>Hydro_LMW_TK_H</locationSetId> <timeSeriesType>temporary</timeSeriesType> <timeStep unit="hour"/> <relativeViewPeriod unit="hour" start="-1" end="0"/> <readWriteMode>add originals</readWriteMode> <synchLevel>9</synchLevel> </timeSeriesSet> </variable> <transformation id="TransformationObservationMinusCorrection"> <user> <simple> <expression>Observation - Correction</expression> <outputVariable> <variableId>Observation_minus_correction</variableId> </outputVariable> </simple> </user> </transformation> ... |
![]()
Navigation using Topology
...