| Note |
|---|
Still to document: TimeSpanComplexType |
...
- description: Optional description
- display: Display complex type
- displayGroup: displayGroup which links to the plot id
locationLoop
By defining a location loop within a displayGroup, the display group will be created for each location of location set configured in the loop.
- locationSetId: id of the location set for which the loop should be created
- includeChildren: boolean to define whether also the child locations of the locations from the location set should be included
- locationRelationId: optional and can be multiple. These elements determine whether also related locations should be included. This applies to relations both to and from the location from the location set.
| Code Block |
|---|
| language | xml |
|---|
| title | horizontalColorCode Example |
|---|
|
	<displayGroup name="Validations Location Loop">
		<displayGroup name=" ">
			<locationLoop>
				<locationSetId>FloodingAreas</locationSetId>
				<includeChildren>true</includeChildren>
				<locationRelationId>L_AREA</locationRelationId>
				<locationRelationId>L_VISIBILIY</locationRelationId>
				<locationRelationId>MEASUREMENT_PARENT</locationRelationId>
			</locationLoop>
			<displayGroup name="Waterbalance">
				<display name="Waterbalance">
					<plotId>Waterbalance</plotId>
				</display>
				<display name="Waterbalance incl. error">
					<plotId>Waterbalance_error</plotId>
				</display>
			</displayGroup>
                           ...
		</displayGroup>
</displayGroup> |
subplot
Root element for each subplot. Multiple sub-plots may be defined per display.
...
A horizontal bar is plotted for each time series. The color of the bars signify the value for that time series at the given time on the x-axis.
...
| Code Block |
|---|
| language | xml |
|---|
| title | horizontalColorCode Example |
|---|
| <plot id="HorizontalColorCodePumps">
<description>testing the horizontal color code plots</description>
<subplot>
<subPlotType>horizontalColorCode</subPlotType>
<barMarginPercentage>30</barMarginPercentage>
<classBreaks>
<break lowerValue="0" color="green" label="off"/>
<break lowerValue="1" color="goldenrod" label="1 pump"/>
<break lowerValue="2" color="magenta" label="2 pumps"/>
<break lowerValue="3" color="aquamarine" label="3 pumps"/>
<break lowerValue="4" color="red"/>
</classBreaks>
<timeSeriesSet>
<moduleInstanceId>Preprocess_Units_HTMS</moduleInstanceId>
<valueType>scalar</valueType>
<parameterId>PO_BFN</parameterId>
<locationId>BFN Tower 1</locationId>
<locationId>BFN Tower 2</locationId>
<locationId>BFN Tower 3</locationId>
<locationId>BFN Tower 4</locationId>
<locationId>BFN Tower 5</locationId>
<locationId>BFN Tower 6</locationId>
<locationId>BFN Tower 7</locationId>
<timeSeriesType>simulated forecasting</timeSeriesType>
<timeStep unit="hour" multiplier="1"/>
<readWriteMode>read only</readWriteMode>
</timeSeriesSet>
</subplot>
</plot> |
|
|---|
| 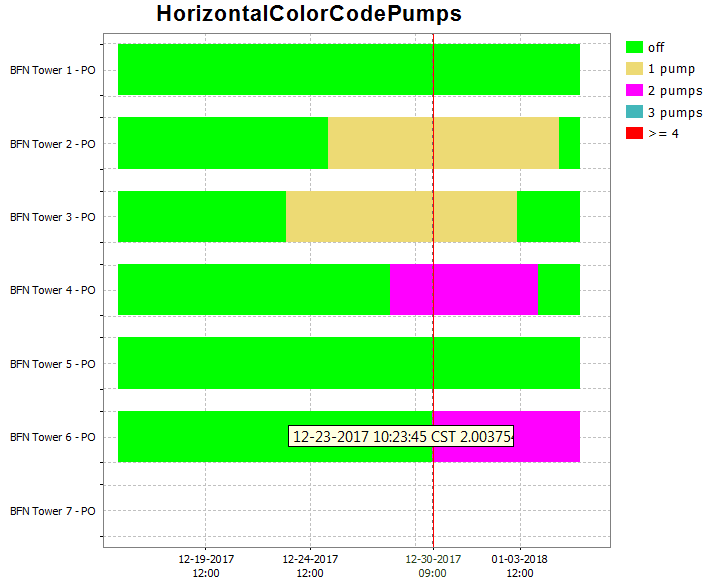 Image Modified Image Modified |
|---|
...
Vertical line fill
Use the <area> element in combination with a <lineStyle> to obtain vertical lines.
...
Below are two examples of a config and the resulting plot.
| Code Block |
|---|
| <subplot>
<plotWeight>1</plotWeight>
<line>
<color>blue</color>
<axis>left</axis>
<timeSeriesSet>
<moduleInstanceId>ImportTelemetry</moduleInstanceId>
<valueType>scalar</valueType>
<parameterId>H.obs</parameterId>
<locationId>Hydro1</locationId>
<timeSeriesType>external historical</timeSeriesType>
<timeStep unit="minute" multiplier="15"/>
<relativeViewPeriod unit="hour" start="-36" end="36"/>
<readWriteMode>editing visible to all future task runs</readWriteMode>
</timeSeriesSet>
</line>
<line>
<color>blue</color>
<axis>left</axis>
<timeSeriesSet>
<moduleInstanceId>ImportTelemetry</moduleInstanceId>
<valueType>scalar</valueType>
<parameterId>H.rated</parameterId>
<locationId>Hydro3</locationId>
<timeSeriesType>external historical</timeSeriesType>
<timeStep unit="minute" multiplier="15"/>
<relativeViewPeriod unit="hour" start="-36" end="36"/>
<readWriteMode>editing visible to all future task runs</readWriteMode>
</timeSeriesSet>
</line>
<line>
<color>red</color>
<axis>right</axis>
<timeSeriesSet>
<moduleInstanceId>ImportTelemetry</moduleInstanceId>
<valueType>scalar</valueType>
<parameterId>Q.obs</parameterId>
<locationId>Hydro2</locationId>
<timeSeriesType>external historical</timeSeriesType>
<timeStep unit="minute" multiplier="15"/>
<relativeViewPeriod unit="hour" start="-36" end="36"/>
<readWriteMode>editing visible to all future task runs</readWriteMode>
</timeSeriesSet>
</line>
<line>
<color>red</color>
<axis>right</axis>
<timeSeriesSet>
<moduleInstanceId>ImportTelemetry</moduleInstanceId>
<valueType>scalar</valueType>
<parameterId>Q.rated</parameterId>
<locationId>Hydro4</locationId>
<timeSeriesType>external historical</timeSeriesType>
<timeStep unit="minute" multiplier="15"/>
<relativeViewPeriod unit="hour" start="-36" end="36"/>
<readWriteMode>editing visible to all future task runs</readWriteMode>
</timeSeriesSet>
</line>
</subplot>
|
|  Image Modified Image Modified
|
| Code Block |
|---|
| <subplot>
<plotWeight>1</plotWeight>
<line>
<color>blue</color>
<axis>right</axis>
<timeSeriesSet>
<moduleInstanceId>ImportTelemetry</moduleInstanceId>
<valueType>scalar</valueType>
<parameterId>H.obs</parameterId>
<locationId>Hydro1</locationId>
<timeSeriesType>external historical</timeSeriesType>
<timeStep unit="minute" multiplier="15"/>
<relativeViewPeriod unit="hour" start="-36" end="36"/>
<readWriteMode>editing visible to all future task runs</readWriteMode>
</timeSeriesSet>
</line>
<line>
<color>red</color>
<timeSeriesSet>
<moduleInstanceId>ImportTelemetry</moduleInstanceId>
<valueType>scalar</valueType>
<parameterId>Q.obs</parameterId>
<locationId>Hydro2</locationId>
<timeSeriesType>external historical</timeSeriesType>
<timeStep unit="minute" multiplier="15"/>
<relativeViewPeriod unit="hour" start="-36" end="36"/>
<readWriteMode>editing visible to all future task runs</readWriteMode>
</timeSeriesSet>
</line>
</subplot>
|
| 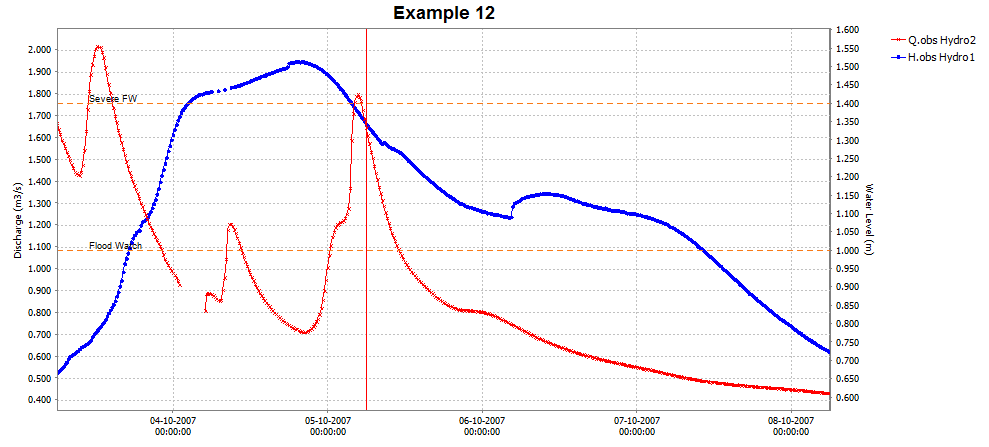 Image Modified Image Modified
Threshold line only for timeseries on the right y axis
|
Stage/discharge plots
When a discharge is displayed, it is possible to show the stage on the right axis. It is not possible to configure this rating on the left axis (and the timeseries on the right axis), since a plot has to have at least one timeseries on the left axis.
...
Below an configuration and resulting plot
| Code Block |
|---|
| <subplot>
<line>
<color>black</color>
<lineStyle>none</lineStyle>
<markerStyle>+</markerStyle>
<markerSize>3</markerSize>
<timeSeriesSet>
<moduleInstanceId>ImportTelemetry</moduleInstanceId>
<valueType>scalar</valueType>
<parameterId>Q.rated</parameterId>
<locationId>Hydro4</locationId>
<timeSeriesType>external historical</timeSeriesType>
<timeStep unit="minute" multiplier="15"/>
<relativeViewPeriod unit="hour" start="-36" end="36"/>
<readWriteMode>editing visible to all future task runs</readWriteMode>
</timeSeriesSet>
</line>
<line>
<color>black</color>
<lineStyle>solid</lineStyle>
<markerStyle>circle</markerStyle>
<markerSize>6</markerSize>
<axis>left</axis>
<ratingAxis>
<parameterGroupId>Water Level</parameterGroupId>
<transformationType>dischargeStage</transformationType>
</ratingAxis>
<timeSeriesSet>
<moduleInstanceId>ImportTelemetry</moduleInstanceId>
<valueType>scalar</valueType>
<parameterId>Q.obs</parameterId>
<locationId>Hydro2</locationId>
<timeSeriesType>external historical</timeSeriesType>
<timeStep unit="minute" multiplier="15"/>
<relativeViewPeriod unit="hour" start="-36" end="36"/>
<readWriteMode>editing visible to all future task runs</readWriteMode>
</timeSeriesSet>
</line>
</subplot>
|
|  Image Modified Image Modified
|
descriptiveFunctions
Adding DescriptiveFunctions will result in an extra panel in the display, showing relevant descriptive information about the timeseries in view. More information on the descriptive functions available can be found onTimeSeriesDisplayConfiguration
...
When a second domain axis is available this will always be used as direction for a polor plot by the time series dialog. When second domain axis is not a directional parameter or the time series has more than two domain axes the time series can not be diplayed the time series dialog with the current functionality

| Code Block |
|---|
|
<subplot>
	<classBreaks>
		<break symbolSize="10" color="000080" lowerValue="0"/>
		<break symbolSize="10" color="0000A8" lowerValue="0.0005"/>
		<break symbolSize="10" color="0000E6" lowerValue="0.001"/>
		<break symbolSize="10" color="004DFF" lowerValue="0.0025"/>
		<break symbolSize="10" color="00B3FF" lowerValue="0.005"/>
		<break symbolSize="10" color="1AFFE5" lowerValue="0.01"/>
		<break symbolSize="10" color="80FF80" lowerValue="0.015"/>
		<break symbolSize="10" color="E6FF19" lowerValue="0.02"/>
		<break symbolSize="10" color="FFB200" lowerValue="0.025"/>
		<break symbolSize="10" color="FF4C00" lowerValue="0.035"/>
		<break symbolSize="10" color="E50000" lowerValue="0.04"/>
		<break symbolSize="10" color="A80000" lowerValue="0.045"/>
		<break symbolSize="10" color="800000" lowerValue="0.05"/>
	</classBreaks>
	<direction>from</direction>
	<timeSeriesSet>
		<moduleInstanceId>Swan_dcsmv6_hirlam_forecast_import</moduleInstanceId>
		<valueType>scalar</valueType>
		<parameterId>Wave.variancedensity2D.voorspeld</parameterId>
		<domainParameterId>f</domainParameterId>
		<domainParameterId>dir</domainParameterId>
		<locationSetId>SWAN_POINTS2</locationSetId>
		<timeSeriesType>simulated forecasting</timeSeriesType>
		<timeStep unit="minute" multiplier="60"/>
		<relativeViewPeriod unit="day" start="-2" end="2"/>
		<readWriteMode>read only</readWriteMode>
	</timeSeriesSet>
</subplot>
|
...
E.g. in the code example below, a wateryear is defined from 1st of October to 30th of September. The startForwardLookingPeriod is defined as 1st of September.
currentSystemTime | view period x-axis (start-end) |
|---|
12 Aug.2012 | 1 Oct.2011 - 30 Sept.2012 |
12 Sept.2012 | 1 Oct.2012 - 30 Sept.2013 |
12 Oct.2012 | 1 Oct.2012 - 30 Sept.2013 |
| Code Block |
|---|
|
<display name="SELI1 - Selway R nr Lowell - SWE">
	<startForwardLookingPeriod>--09-01</startForwardLookingPeriod>
	<season>
		<startMonthDay>--10-01</startMonthDay>
		<endMonthDay>--09-30</endMonthDay>
	</season>
	<locationId>SELI1L</locationId>
	<locationId>SELI1U</locationId>
	<plotId>SWE</plotId>
</display>
|
...