...
| Code Block |
|---|
| language | xml |
|---|
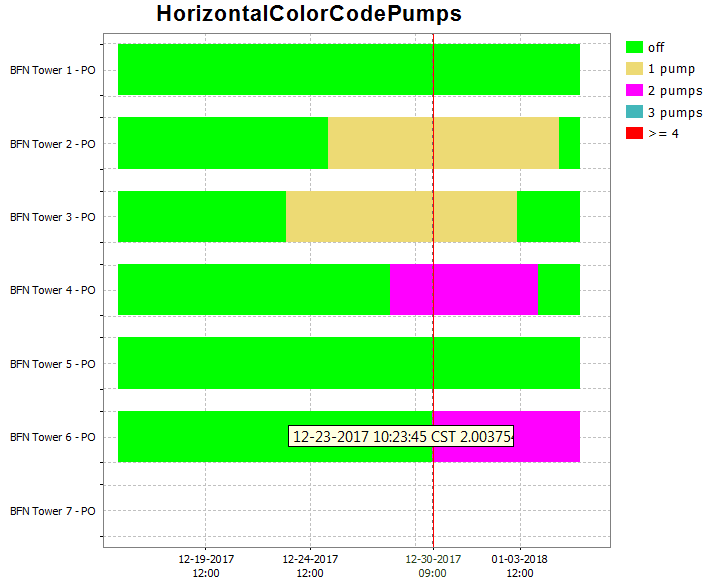
| title | horizontalColorCode Example |
|---|
| <plot id="HorizontalColorCodePumps">
<description>testing the horizontal color code plots</description>
<subplot>
<subPlotType>horizontalColorCode</subPlotType>
<barMarginPercentage>30</barMarginPercentage>
<classBreaks>
<break lowerValue="0" color="green" label="off"/>
<break lowerValue="1" color="goldenrod" label="1 pump"/>
<break lowerValue="2" color="magenta" label="2 pumps"/>
<break lowerValue="3" color="aquamarine" label="3 pumps"/>
<break lowerValue="4" color="red"/>
</classBreaks>
<timeSeriesSet>
<moduleInstanceId>Preprocess_Units_HTMS</moduleInstanceId>
<valueType>scalar</valueType>
<parameterId>PO_BFN</parameterId>
<locationId>BFN Tower 1</locationId>
<locationId>BFN Tower 2</locationId>
<locationId>BFN Tower 3</locationId>
<locationId>BFN Tower 4</locationId>
<locationId>BFN Tower 5</locationId>
<locationId>BFN Tower 6</locationId>
<locationId>BFN Tower 7</locationId>
<timeSeriesType>simulated forecasting</timeSeriesType>
<timeStep unit="hour" multiplier="1"/>
<readWriteMode>read only</readWriteMode>
</timeSeriesSet>
</subplot>
</plot> |
| |
|---|
leftAxis and rightAxis
Use elements leftAxis and rightAxis to confiure the axes separately.If the rightAxis is configured, the leftAxis must be configured too.
An example :
| Code Block |
|---|
<subplot>
       <leftAxis min="-10" max="100"/>
		<axisLabel>Label left axis</axisLabel>
   		<lowerMarginPercentage>10</lowerMarginPercentage>
   		<upperMarginPercentage>20</upperMarginPercentage>
	</leftAxis>

    <rightAxis min="20" max="50"/>
		<axisLabel>Label right axis</axisLabel>
   		<lowerMarginPercentage>5</lowerMarginPercentage>
   		<upperMarginPercentage>5</upperMarginPercentage>
	</rightAxis>
..... |
If the optional attributes min and max are not configured, then subplot attributes min and max are used.
Vertical line fill
Use the <area> element in combination with a <lineStyle> to obtain vertical lines.
...