| scrollbar |
|---|
| Table of Contents |
|---|
General
The dashboard display - available since Delft-FEWS 2019.02 - is used to view several displays side-by-side. The functionality is limited to time series plots (selected via the data viewer), display groups, grid (or spatial) displays, and buttons panel displays. For example, it can be used to view both a precipitation and a temperature grid plot side-by-side, synchronizing the time sliders. Or, as another example, it could be used to see display groups together with a spatial display.
When a time series plot is added to a dashboard, the settings of the visibility dialog is also preserved. Thus, if for example a time series is made invisible on the time series display, it will remain invisible on the dashboard panel as well.
All users can create and modify their own dashboards, which will be stored in the user settings. Alternatively, a configurator can configure "predefined" dashboards which will be the same for all users. An example of a dashboard display is shown below.


Creating and modifying a Dashboard Display
Dashboard panels can be created and modified by the user to suit their needs.
Creating a new Dashboard
A new Dashboard can be created through the menu option of the dashboards menu in the FEWS menu bar:

You will then be prompted to enter a title for the new dashboard. The title will be used as the title of the tab for the panel, as well as for the menu item to (re)open the dashboard. The title needs to be unique.

After entering a title and confirming, a new (empty) dashboard panel will be opened and it will be added to the dashboards menu.
![]()
Adding Spatial Display Frames
To add a new Spatial Display frame to a dashboard, navigate to a Spatial Display and use the "Add to Dashboard" button found in the toolbar. Clicking this button will add a copy of the spatial display as a frame to the current open user-defined dashboard. If several user-defined dashboards are open, you will be prompted to choose a dashboard to which it will be added. If no user-defined dashboards are open, you will be asked to open a dashboard first. New frames can only be added to user-defined dashboards.

After adding a frame to a dashboard, the dashboard to which it was added will be brought into focus automatically.

While it is possible to later modify the contents of the frame, for example, to select a different grid plot or change the accumulation, it is advisable to set these as you want them to be before adding a copy of the spatial display to the dashboard.
Adding Time Series Dialog Frames
It is possible to add frames from the Time Series Dialog to a dashboard, the graphs can be either based on Display Groups (since 2020.02) or the Data Viewer selection (since 2021.02).
In order to do this the "Add to dashboard button" on the top left of the Time Series Dialog can be clicked.
For this to work a dashboard already needs to be created and opened.

Modifying Frame Contents
Spatial Display frames will only show the map and plot. To gain access to the plot tree, accumulation slider and legend, a frame must be maximized. This can be done by clicking the maximize button on the frame, or double-clicking its title.

By maximizing a frame, its plot selection and accumulation can be changed. When restoring the frame to its original size (by clicking the restore button or double-clicking its title), the left panel will be hidden again.
Maximized frames also have access to the spatial thumbnails ![]() , these will be automatically hidden (and the button will be disabled) when the frame is restored to its original size.
, these will be automatically hidden (and the button will be disabled) when the frame is restored to its original size.
Arranging the Frames
Dashboard frames can be resized as by dragging the border as you usually would. The drop-down menu of the ![]() dashboard button also offers three options to aid in arranging the dashboard frames:
dashboard button also offers three options to aid in arranging the dashboard frames:
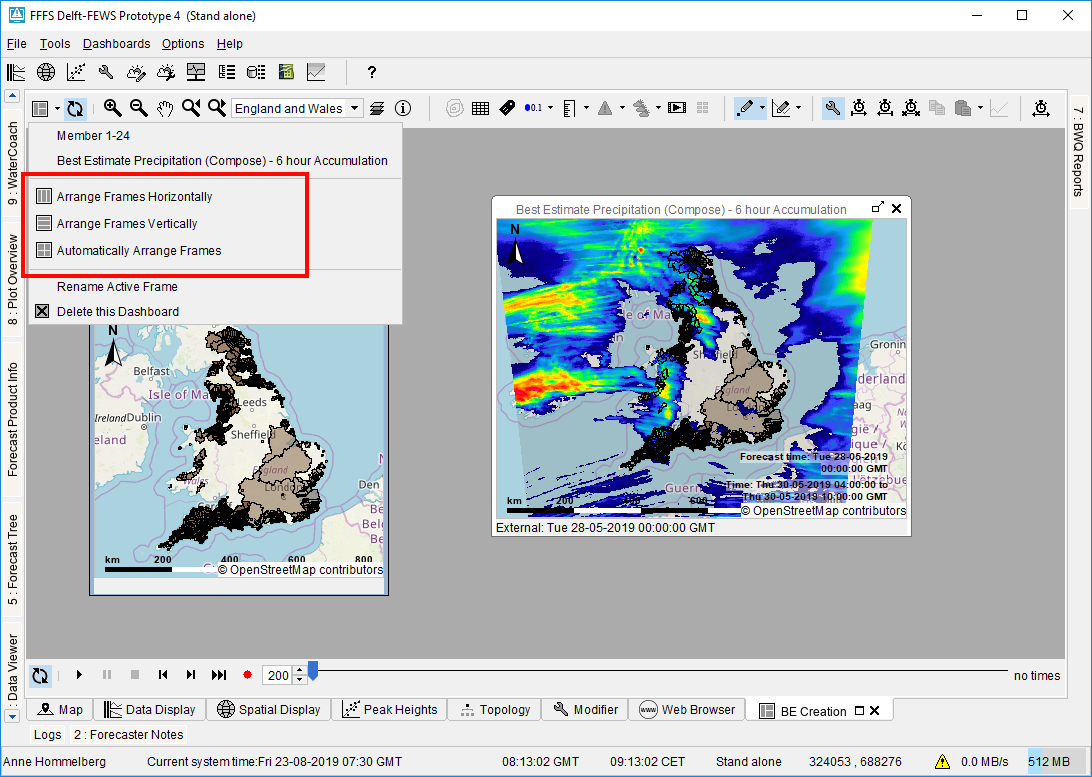
Arrange Frames Horizontally
This option will arrange all frames from left to right, giving each an equal amount of horizontal space. The frames will be kept in the same "left-to-right" order they are currently in.
Arrange Frames Vertically
This option will arrange all frames from top to bottom, giving each an equal amount of vertical space. The frames will be kept in the same "top-to-bottom" order they are currently in.
Arrange Frames Automatically
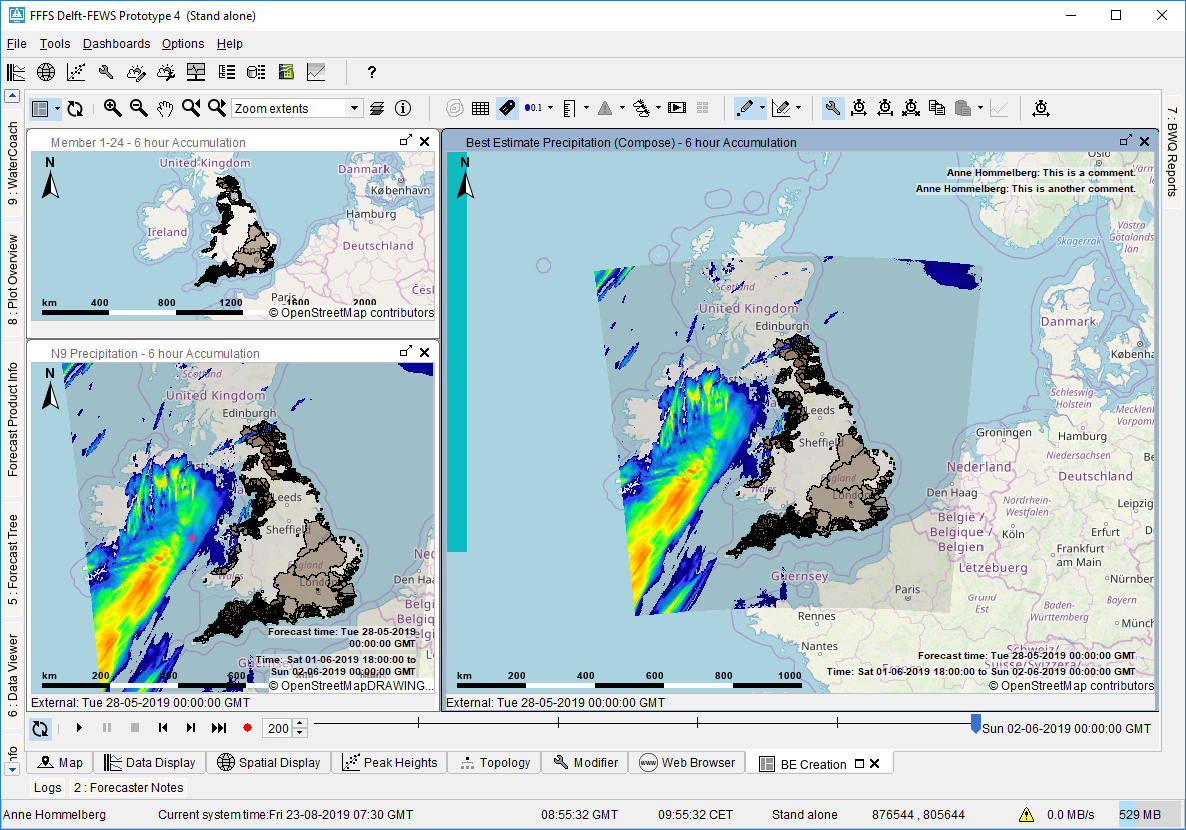
This option will move and scale the current desktop window to ensure all frames fit in it exactly, remove as much overlap between frames as possible, and finally remove as much empty space as possible. While doing so, it will always prefer the top frame to be made larger and the bottom frame to be made smaller. Examples for when this options will come in handy are:
- If you've resized the FEWS application / dashboard panel, several frames may have become (partially) invisible. The "Arrange Frames Automatically" would result in all frames being visible again.
- If you wish to arrange the frames in a different pattern than left to right or top to bottom.
- If you wish to resize one of your frames but doing so makes it overlap with the frame(s) next to it.
For example, the situation before using the "Arrange Frames Automatically" option is shown on the left while the result is shown on the right in the screenshots below:

Frame Titles
On newly added frames, the title will always be constructed automatically. The title of such a frame is the name of the grid plot, followed by the selected accumulation (if any). The title is updated automatically if the grid plot or accumulation is changed. Since several grid plots may have the same name, it is possible to give custom titles to frames. To do so, first select the frame you wish to rename and then use the "Rename Active Frame" option in the dashboard drop-down menu. Once a frame has been given a custom title, it will always have that title even if the grid plot shown or the accumulation is changed.
The option to rename frames is only available for user-defined dashboards. For predefined dashboards, whether a frame should have a fixed (custom) name or should have a name that is constructed automatically, has already been decided by the configurator.
Deleting a frame
Frames in user-defined dashboards can be deleted from the dashboard by closing the frame (through the close-button in the frame's title bar). The frame will be permanently deleted from the dashboard, so after closing an reopening the dashboard, the frame will still be gone.
Frames in predefined dashboards can be closed as well, but upon closing and reopening the dashboard, the frame will reappear as it was defined in the dashboards.ini file.
Deleting a dashboard
User-defined dashboards can be deleted through the "Delete this Dashboard" option in the drop-down menu of the dashboard button. This will remove the dashboard from the user settings and from the dashboard menu in the FEWS toolbar.
Hiding a dashboard
It is possible to hide dashboards from the menu bar. To do so, specify the following in the Explorer.xml:
<userDashboards> <enabled>false</enabled> </userDashboards>
In addition, make sure the dashboard.ini file, containing the predefined dashboards, is absent!
When dashboards are hidden, the dashboard-button in the grid-display disappears as well.
Dashboard Management Panel
Since Delft-FEWS 2020.02, Dashboard management panel is added to the Dashboards menu. Through the dashboard management panel, it is possible to manage public and private dashboards. On the left panel, all public dashboards of other users as well as the public dashboards of the current user are visible. The Refresh button could be used to update the list of public dashboards. If the current user wishes to copy a public dashboard of another user to a private dashboard of his/her own, or if the current user wishes to turn one of his/her own public dashboards to a private one, the button with the right arrow (in the figure below) could be used.
In addition, all user defined dashboards are private by default, and stored in user_settings.ini. However, the user can choose to set the private dashboards to public, using the button with the left arrow (in the figure below). This way, users can share dashboards with each other. To identify the visibility of the dashboards, a flag called "public" is used in the dashboard sections of the user_settings.ini.
Dashboard management panel also enables the current user to rename or delete a private dashboard. Especial characters such as "[( : , )]" are not allowed when renaming a dashboard.
Before the Dashboard management panel is opened, and after the OK button is pressed, the current state of user_settings.ini is stored in the data store for the purpose of synchronizing the dashboard states.

Using a Dashboard Display
Opening a Dashboard Display
To open a dashboard, simply select the dashboard title in the dashboard menu in the top FEWS menu bar. This will open the dashboard, or if it is already open, bring the dashboard into focus.
Accessing the frame toolbars
The dashboard panel has toolbars on the top and bottom of the panel. When a frame is selected / active, its toolbars are added to the dashboard panels toolbar, thus allowing the user to access all buttons they would ordinarily have access to. In the screenshot below, the dashboard panel's button section's have been highlighted in green, while the grid display toolbar's of the active frame have been highlighted in red:

Since the right-frame is active (and synchronization has been turned of), using any of the buttons in the toolbar sections marked red will only influence the contents of the right-frame. If the user wishes to change something for the left frame, they must first select the left-frame to get access to its toolbars (the grid display button sections will then be replaced by the toolbars of the left grid display and only influence the left frame).
Synchronizing Frames
The dashboard panel can synchronize the times or map extents of its frames.
Map Extent Synchronization
The ![]() synchronize button in the top toolbar controls whether the map extents of the frames should be synchronized. When this button is on, changing the zoom level in one of the frames will also update the zoom level in the other frames.
synchronize button in the top toolbar controls whether the map extents of the frames should be synchronized. When this button is on, changing the zoom level in one of the frames will also update the zoom level in the other frames.
This option works best if all frames are roughly the same size. It may also be wise to turn this option off while manually rearranging frames, since changing the frame sizes will cause constant updates of the zoom level which are then propagated to the other frames, using a lot of resource to repaint the maps and making FEWS run slow.
Time Slider Synchronization
The ![]() synchronize button in the bottom toolbar controls whether the times of the frames should be synchronized. When this button is on, changing the selected time on the time slider, or starting the animation through the play button, will also update the times of the other frames. This allows the user to quickly compare the same time steps in different plots. When this button is on, pressing the Apply button in set time dialog
synchronize button in the bottom toolbar controls whether the times of the frames should be synchronized. When this button is on, changing the selected time on the time slider, or starting the animation through the play button, will also update the times of the other frames. This allows the user to quickly compare the same time steps in different plots. When this button is on, pressing the Apply button in set time dialog ![]() makes all other dashboard frames to have the same period. (In a given frame, using the scroll wheel, the user can zoom in and out, and thereby change the period of a given frame, which can be applied to the other frames using the sync button and set time dialog.)
makes all other dashboard frames to have the same period. (In a given frame, using the scroll wheel, the user can zoom in and out, and thereby change the period of a given frame, which can be applied to the other frames using the sync button and set time dialog.)
User-defined vs. Predefined Dashboard Displays
While it is possible for users to create and customize their own dashboards, it can also be advisable to provide several predefined dashboards through the configuration so users don't have to construct common dashboards themselves. While user-defined dashboards are stored in the user settings, predefined dashboards are configured through a dashboards.ini file, which is a root config file. To share the preconfigured dashboards with other operator clients (OCs), dashboards.ini needs to be included in the otherRootConfigFiles element of the clientConfig file. An example is provided below. For further information, please refer to the clientConfig Wiki page.
<otherRootConfigFiles>...
<name>dashboards.ini</name> </otherRootConfigFiles>
Predefined dashboards will be shown in a separate section of the dashboards menu than user-defined dashboards. In the example below there is one predefined dashboard present in the system "BE Creation", and one user-defined dashboard called "My Custom Dashboard".

Section 1 contains the predefined dashboard(s) and section two the user-defined dashboard(s).
There are several differences in between user-defined dashboards and predefined dashboards:
| user-defined | predefined | |
|---|---|---|
| sharing | user specific, shared through userSettings | shared between all users and the same for all users |
| creator | created by a user | created / configured by a configurator |
| customization | can be customized by the user, i.e., frames can be added / removed, frame titles can be changed, frames can be deleted | can not be customized, i.e., no new frames can be added, if a frame is closed the change won't persist when reopening the dashboard, frame titles can't be changed |
| storage | stored in the user_settings.ini file | stored in the dashboards.ini file |
Configuring a Predefined Dashboard
To configure a predefined dashboard, simply construct the dashboard you wish to make as a user-defined dashboard in a standalone. Once you are satisfied with the contents of the dashboard, you can use the debug menu (F12) of the dashboard panel, to turn the user-defined dashboard you constructed into a predefined dashboard. This will mean FEWS will automatically move the information stored for that dashboard from the user_settings.ini file to the dashboards.ini file. A new dashboards.ini file will be created if there is none, or the information will be added if there already is a dashboards.ini file present. FEWS will automatically restart, and after this restart the dashboard will now be included in the predefined dashboards section instead of the user-defined dashboards section.
If a configurator wished to make changed to a predefined dashboard, they can use a standalone environment and use the debug menu (F12) of the dashboard panel to turn the predefined dashboard back into a user-defined dashboard. This will perform the reverse action, moving the dashboard settings back from the dashboards.ini into the user_settings.ini. After the automatic restart, changes to the dashboard can be made. Once satisfied, the debug menu can be used to turn the now user-defined dashboard back into a predefined dashboard.
Note that aside from the logical settings such as the frames and the dashboard title, the dashboard settings stored in the ini-files also include the following:
- the way the frames are arranged on the desktop
- the button status of the grid display toolbars for each frame
- the status of the synchronization buttons
It is advisable to always check if the dashboard looks as you want it to look when (re)-opening it, before turning it into a predefined dashboard.
It is possible to assign a permission to predefined dashboards to control which users will be able to access it through the Explorer.xml. More information on this is found at Configuration Guide > System Configuration > FEWS Explorer > Predefined Dashboards.