...
Option to show a time navigator toolbar at the top of this schematic status display. The time navigator toolbar can be used to select the display time for this schematic status display. It is only possible to select a display time that is contained within the configured relative period and is a valid time according to the configured time step. This period is always relative to the current system time. If the current system time changes, then the display time is reset to the current system time. If this option is not specified, then the time navigator toolbar is not shown.
| Expand |
|---|
Time Navigator Toolbar Configuration Options
timeNavigatorTimeStepThe default timestep by which the time navigator slider moves is by default the cardinal timestep which is configured in the explorer.xml configuration file, see FEWS Explorer Configuration. This optional element can be used to use a different timestep for the time navigator than the cardinal timestep. |
backgroundColor
Optional configuration for the background color of the scadaPanels. This options also works with the defaultCustomColorKeys that can be used in combination with color schemes that will allow you to select a different color for each color schem. To use a custom color, the bracket notations is required to refer to a custom color. For example:
| Code Block |
|---|
<backgroundColor>[MY_blue]</backgroundColor> |
dateFormat
Definitions of dateFormats that can be used for formatting dates and times in tags in texts of svg objects.
numberFormat
Definitions of numberFormats that can be used for formatting numbers in tags in texts of svg objects.
variable
Definitions of variables that can be used as input and/or output for the components in the schematic status display. A variable is always a time series. Alternatively variable definitions can be embedded in the configuration below.
scadaPanel
The ScadaPanel element is the central element in the configuration. The configuration can hold one or more definitions of schematic status panels. In the user interface each schematic status panel will be available from the list in this schematic status display.
Time Navigator Toolbar Configuration Options
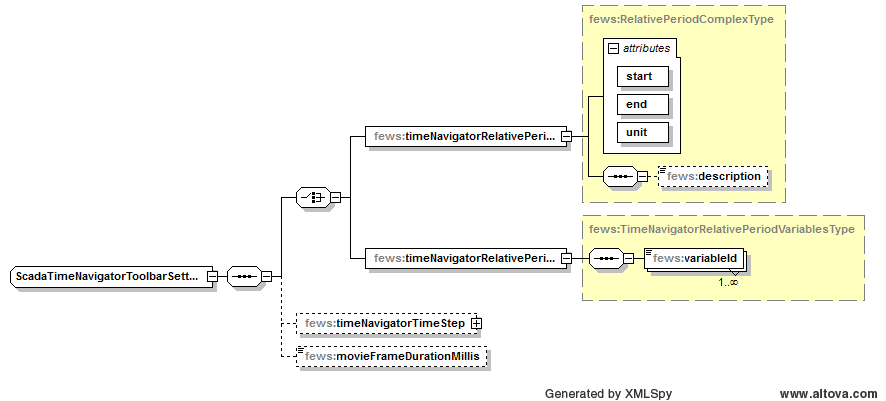
Time navigator toolbar configuration elements
timeNavigatorRelativePeriod
This is the period of the time navigator toolbar (slider) in this schematic status display. The time navigator toolbar can be used to select the display time for this schematic status display. It is only possible to select a display time that is contained within this period and is a valid time according to the cardinal time step (which is configured in the explorer.xml configuration file, see FEWS Explorer Configuration). This period is always relative to the current system time. If the current system time changes, then the display time is reset to the current system time. The start and end of the period are both included.
timeNavigatorRelativePeriodVariables
Instead of the timeNavigatorRelativePeriod element, it is also possible to configure the relative view period using the timeNavigatorRelativePeriodVariables element. Using this element a list of variableId's have to be specified that refer to variables defined in the scada display configuration. For each specified variable the relative view period of the timeseriesset is determined and will be joined together into a relative view period that includes all previous periods. The resulting calculated period will be used for the time navigator toolbar. To be able to determine the relative view period, the timeSeriesSet the variables reference should be set to: <readWriteMode>read complete forecast</readWriteMode>.
This period is always relative to the current system time, similar to the timeNavigatorRelativePeriod. A typical configuration might look as follows:
...
<timeNavigatorRelativePeriodVariables>
     <variableId>variableId1</variableId>
     <variableId>variableId2</variableId>
</timeNavigatorRelativePeriodVariables>timeNavigatorRelativePeriodThis is the period of the time navigator toolbar (slider) in this schematic status display. The time navigator toolbar can be used to select the display time for this schematic status display. It is only possible to select a display time that is contained within this period and is a valid time according to the cardinal time step (which is configured in the explorer.xml configuration file, see FEWS Explorer Configuration). This period is always relative to the current system time. If the current system time changes, then the display time is reset to the current system time. The start and end of the period are both included. timeNavigatorRelativePeriodVariablesInstead of the timeNavigatorRelativePeriod element, it is also possible to configure the relative view period using the timeNavigatorRelativePeriodVariables element. Using this element a list of variableId's have to be specified that refer to variables defined in the scada display configuration. For each specified variable the relative view period of the timeseriesset is determined and will be joined together into a relative view period that includes all previous periods. The resulting calculated period will be used for the time navigator toolbar. To be able to determine the relative view period, the timeSeriesSet the variables reference should be set to: <readWriteMode>read complete forecast</readWriteMode>. This period is always relative to the current system time, similar to the timeNavigatorRelativePeriod. A typical configuration might look as follows:
Suppose variableId1 has the following relative view period: <relativeViewPeriod start="-1" end="6" unit="day"/> And variableId2 has the following relative view period: <relativeViewPeriod start="-2" end="5" unit="day"/> The resulting relative view period used by the time navigator toolbar will be: <relativeViewPeriod start="-2" |
...
end="6" unit="day"/> |
...
timeNavigatorTimeStepThe |
And variableId2 has the following relative view period: <relativeViewPeriod start="-2" end="5" unit="day"/>
The resulting relative view period used by the time navigator toolbar will be: <relativeViewPeriod start="-2" end="6" unit="day"/>
timeNavigatorTimeStep
...
timestep by which the time navigator slider is moved, by default the cardinal timestep which is configured in the explorer.xml configuration file. This optional element can be used to use a different timestep for the time navigator than the cardinal timestep. movieFrameDurationMillisThe duration of a frame when the time navigator is animating. This is the number of milliseconds a frame/time step is visible before the next time step becomes visible. If this option is not specified, then 200 milliseconds is used by default. When the CPU is too slow to display the specified frame rate, a frame will be displayed longer than specified. activateThe activate option is default true and can be set to false to show the time navigator in an inactive state. In this state the time navigator listens to the system time as if there was no time navigator configured at all. showTimeNavigatorActivationToggleUsing the showTimeNavigatorActivationToggle option (default false) will allow you to switch the time navigator between active and inactive with a toggle button on the navigator toolbar. |
Scada Panel Configuration Options

Schematic status panel configuration elements
id
Identifier of this schematic status panel.
name
The name of this schematic status panel as it is displayed in the user interface. If not specified, then id is used as name.
svgFile
The name of an svg (Scalable Vector Graphics) file in the ReportImageFiles directory. This schematic status panel shows all svg objects that are defined in the specified svg file. The svg objects in the svg file can be given special behaviour and/or properties using the configuration below. See http://www.w3.org/TR/SVG11/ for the SVG 1.1 specification.
overrulingTimeNavigatorTimeStep
Since 2015.02. Optional. The timestep by which the time navigator slider is moved for this scada panel. This overrules the timeNavigatorTimeStep that is configured for the scada display as a whole. This timestep is only used when showTimeNavigatorToolbar is configured for the scada display.
nodeId
Optional. Identifier that refers to a node in the topology configuration file. If specified, then the referenced topology node will be selected when this scadaPanel is selected in the user interface. When the topology node is selected, then that may cause other things to be selected as well, like e.g. the displayGroup in the TimeSeriesDisplay that corresponds to that node.
backgroundColor
Optional configuration for the background color of a specific panel. If no color is configured, the background color that is configured for the scada display will apply.
permission
Optional. Hides the panel when this permission is not available for the logged on user in the Permissions.xml in theSystemConfigFiles.
textComponentBehaviourDefinition
One or more items to define special behaviour and/or properties for text components in this schematic status panel. Each item refers to an svg object that is defined in the given svg file. Each item also contains definitions of behaviour and/or properties for that object. This way it is possible to e.g. replace tags in the text of a text object with certain values from a certain time series, or to define what should happen when the user clicks on a certain component.
Definition of special behaviour and/or properties for a text component in this schematic status panel. This refers to an svg object of type "text" that is defined in the given svg file. This contains definitions of behaviour and/or properties for that svg object. An svg object of type "text" can be a "text", "tspan", "tref", "textPath" or "altGlyph" element.
shapeComponentBehaviourDefinition
One or more items to define special behaviour and/or properties for shape components in this schematic status panel. Each item refers to an svg object that is defined in the given svg file. Each item also contains definitions of behaviour and/or properties for that object. This way it is possible to e.g. replace tags in the text of a text object with certain values from a certain time series, or to define what should happen when the user clicks on a certain component.
Definition of special behaviour and/or properties for a shape component in this schematic status panel. This refers to an svg object of type "shape" that is defined in the given svg file. This contains definitions of behaviour and/or properties for that svg object. An svg object of type "shape" can be a "path", "rect", "circle", "ellipse", "line", "polyline" or "polygon" element.
chartComponentBehaviourDefinition
One or more items to define special behaviour and/or properties for chart components in this schematic status panel. Each item refers to an svg object that is defined in the given svg file. Each item also contains definitions of behaviour and/or properties for that object. This way it is possible to insert timeseries charts defined in the DisplayGroups configuration. Such charts are implicitly linked to a leftSingleClickAction that opens the same chart in a new time series dialog. By default, this the left click is disabled. But if the user wishes, leftSingleClickAction can be configured to enable the possibility to open a new time series dialog.
...
backgroundColor
Optional configuration for the background color of the scadaPanels. This options also works with the defaultCustomColorKeys that can be used in combination with color schemes that will allow you to select a different color for each color schem. To use a custom color, the bracket notations is required to refer to a custom color. For example:
| Code Block |
|---|
<backgroundColor>[MY_blue]</backgroundColor> |
dateFormat
Definitions of dateFormats that can be used for formatting dates and times in tags in texts of svg objects.
numberFormat
Definitions of numberFormats that can be used for formatting numbers in tags in texts of svg objects.
variable
Definitions of variables that can be used as input and/or output for the components in the schematic status display. A variable is always a time series. Alternatively variable definitions can be embedded in the configuration below.
| Expand |
|---|
Variable Configuration Options
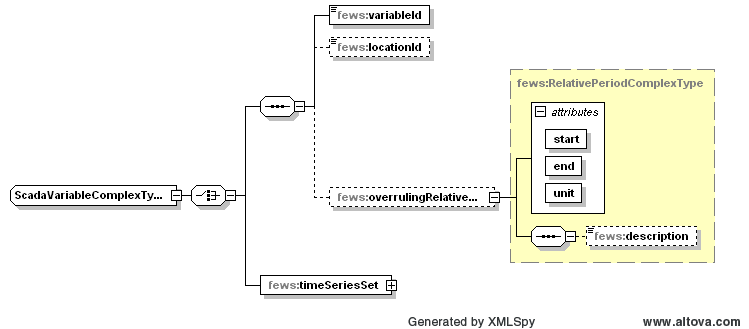
Choose between a reference to a variable or an embedded definition of a variable. variableIdIdentifier of a variable to use. locationIdIf the specified variable contains multiple locations, then specify the location to use here. overrulingRelativeViewPeriodOptional time period for which data should be read. This time period overrules the viewPeriod in the timeSeriesSet of the referenced variable. This time period is relative to the selected display time in this scada display. The start and end of the period are both included. If the start and/or end of the period is not a valid time according to the timeStep of the variable, then the start and/or end is shifted to the previous valid time (e.g. for a period from 15:20 hours to 16:20 hours and a whole hour timeStep the period is shifted to be 15:00 hours to 16:00 hours). timeSeriesSetA time series set that can be used as input for a component. |
transformation
Definitions of transformations that can be used to transform timeseries from the database in a way that matches the required behaviour in the display.
| Expand |
|---|
Transformations within ScadaDisplayUp to 2011_01 it is necessary that all data to be displayed in the ScadaDisplay is beforehand available as time series. This includes simple sums and differences between other time series. From 2011_02 onwards, it is possible to include in the ScadaDisplay configuration one or more transformations. These transformations will make it easier to use derived time series. The derived timeseries will be calculated on-the-fly as temporary timeseries. The transformations are processed in the order they appear in the configuration. NB. For 2011_02 only the UserSimpleFunction is supported and tested as a transformation that can be used. Sample configuration for transformations within the ScadaDisplayNB. It is required that the timeSeriesType of output variables are set to temporary. |
scadaPanel
The ScadaPanel element is the central element in the configuration. The configuration can hold one or more definitions of schematic status panels. In the user interface each schematic status panel will be available from the list in this schematic status display.
Most important within this configuration element is the specification of behaviour for text-objects, shape-objects or chart-objects.
Schematic status panel configuration elements
id
Identifier of this schematic status panel.
name
The name of this schematic status panel as it is displayed in the user interface. If not specified, then id is used as name.
svgFile
The name of an svg (Scalable Vector Graphics) file in the ReportImageFiles directory. This schematic status panel shows all svg objects that are defined in the specified svg file. The svg objects in the svg file can be given special behaviour and/or properties using the configuration below. See http://www.w3.org/TR/SVG11/ for the SVG 1.1 specification.
overrulingTimeNavigatorTimeStep
Since 2015.02. Optional. The timestep by which the time navigator slider is moved for this scada panel. This overrules the timeNavigatorTimeStep that is configured for the scada display as a whole. This timestep is only used when showTimeNavigatorToolbar is configured for the scada display.
nodeId
Optional. Identifier that refers to a node in the topology configuration file. If specified, then the referenced topology node will be selected when this scadaPanel is selected in the user interface. When the topology node is selected, then that may cause other things to be selected as well, like e.g. the displayGroup in the TimeSeriesDisplay that corresponds to that node.
backgroundColor
Optional configuration for the background color of a specific panel. If no color is configured, the background color that is configured for the scada display will apply.
permission
Optional. Hides the panel when this permission is not available for the logged on user in the Permissions.xml in theSystemConfigFiles.
textComponentBehaviourDefinition
Text objects can obtain special behaviour in this schematic status panel via the textComponentBehaviourDefinition. Each item refers to an svg object of type "text" that is defined in the given svg file. An svg object of type "text" can be a "text", "tspan", "tref", "textPath" or "altGlyph" element. Each item can be assigned behaviour and/or properties for that object. This way it is possible to e.g. replace tags in the text of a text object with certain values from a certain time series, or to define what should happen when the user clicks on a certain component.
| Expand |
|---|
Text component Behaviour configuration options available are:
|
shapeComponentBehaviourDefinition
Shape objects can obtain special behaviour in this schematic status panel via the shapeComponentBehaviourDefinition. This refers to an svg object of type "shape" that is defined in the given svg file. An svg object of type "shape" can be a "path", "rect", "circle", "ellipse", "line", "polyline" or "polygon" element. Each item can be assigned behaviour and/or properties for that object. This way it is possible to e.g. give a color to an object based on a trheshold crossing of a timeseries.
| Expand |
|---|
Shape component Behaviour configuration options available are:
|
chartComponentBehaviourDefinition
Since 2022.02, one can also include small thumbnail graphs referencing a display from the DisplayGroups in a schematic status panel. Such charts are implicitly linked to a leftSingleClickAction that opens the same display in a new time series dialog. By default, this the left click is disabled. But if the user wishes, leftSingleClickAction can be configured to enable the possibility to open a new time series dialog.
Charts are rendered as SVG <image> elements for embedding them in a schematic status panel. A practical problem with this is that empty <image> elements in a SVG file are considered in error and SVG editors (i.e. InkScape) that typically are used to prepare the SVG files will not allow you to insert <image> elements without an actual image attached. Therefore any shape element (<rect> is recommend) that has width and height properties can be used as a placeholder, that will be replaced by an image as the SVG file is processed.
| Expand |
|---|
Shape component Behaviour configuration options available are:
|
axisLabels
Optional boolean to indicate of the axisLabels from the display-configuration should be included.
axisTitle
Optional boolean to indicate of the axisTitle from the display-configuration should be included.
imageScaleFactor
Optional scale factor to fine tune the resolution of the chart as the size differs from the original size in the TimeSeriesdisplay.
Below is an example of a chartComponentBehaviourDefinition element, including some of the possible configurations.
| Code Block | ||||
|---|---|---|---|---|
| ||||
<chartComponentBehaviourDefinition>
	<svgObjectId>chart_Ijsselmeer</svgObjectId>
	<title>Waterstand IJsselmeer</title>
	<display>
		<displayId>Waterstand_IJsselmeer</displayId>
		<overrulingRelativeViewPeriod unit="hour" start="-48" end="72"/>
	</display>
	<axisLabels>true</axisLabels>
	<axisTitle>true</axisTitle>
	<imageScaleFactor>1.5</imageScaleFactor>
</chartComponentBehaviourDefinition> |
Component behaviour configuration options
svgObjectId
The id of the object in the svg file for which this item defines special behaviour and/or properties.
...
Optional. If specified, then a toolTip with the specified text is displayed for this component.
Below is an example of a chartComponentBehaviourDefinition element, including some of the possible configurations.
...
component.
linkPropertiesToData
Optional. Contains options to link properties of this component to actual data values. For example the height of the component can be changed depending on the data values of a specified variable.
...
If the data value is greater than or equal to dataUpperLimit, then the rotation will be equal to rotationUpperLimit.
rotationLowerLimit
The rotation (in degrees) that corresponds to the dataLowerLimit value. This rotation is always relative to the rotation angle that is specified for this component in the svg file.
rotationUpperLimit
The rotation (in degrees) that corresponds to the dataUpperLimit value. This rotation is always relative to the rotation angle that is specified for this component in the svg file.
anchorPointX
The x coordinate of the anchor point. The rotation will be around the anchor point. This x coordinate has to be specified in the user space coordinate system of the svg object for this component in the svg file. The user space coordinate system is determined by all transforms that are specified in the parent svg objects of the svg object for this component. All transforms that are specified in the svg object itself are not part of the user space coordinate system and thus should be taken into account in the coordinates that are specified here. E.g. to rotate a "rect" svg object with attributes width="200" height="200" x="500" y="300" transform="translate(50 0)" around its center, use anchorPoint coordinates (x, y) = (650, 400). See also Determining the rotation anchor point for an SVG object in user space coordinates.
anchorPointY
, then the rotation will be equal to rotationUpperLimit.
rotationLowerLimit
The rotation (in degrees) that corresponds to the dataLowerLimit value. This rotation is always relative to the rotation angle that is specified for this component in the svg file.
rotationUpperLimit
The rotation (in degrees) that corresponds to the dataUpperLimit value. This rotation is always relative to the rotation angle that is specified for this component in the svg file.
anchorPointX
The x The y coordinate of the anchor point. The rotation will be around the anchor point. This y x coordinate has to be specified in the user space coordinate system of the svg object for this component in the svg file. The user space coordinate system is determined by all transforms that are specified in the parent svg objects of the svg object for this component. All transforms that are specified in the svg object itself are not part of the user space coordinate system and thus should be taken into account in the coordinates that are specified here. E.g. to rotate a "rect" svg object with attributes width="200" height="200" x="500" y="300" transform="translate(50 0)" around its center, use anchorPoint coordinates (x, y) = (650, 400). See also Determining the rotation anchor point for an SVG object in user space coordinates.
Use Threshold Warning Level Colors Configuration Options
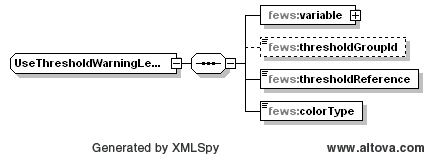
Use threshold warning level colors configuration elements
variable
The data for this variable is used to determine threshold crossings. For crossed thresholds, warningLevels are activated. The color of the most severe activated warningLevel is used as the fill and/or stroke color for the component, as specified below.
thresholdGroupId
Optional. If specified, then only thresholds in the specified thresholdGroup are used in the determination of threshold crossings and warningLevels for the specified variable. If not specified, then thresholds in all thresholdGroups are used.
thresholdReference
Specify which data is used for determining threshold crossings. Either choose the first or last reliable or doubtful value within the relative view period, or choose all reliable or doubtful values within the relative view period. Can be "first_value", "last_value" or "relative_view_period".
colorType
Specify which color type (fill and/or stroke) should be changed to use warningLevel colors. Color types that are not specified here are not changed. Can be "fill", "stroke" or "fill_and_stroke".
Use Threshold Warning Level Symbols Configuration Options

The fields in this xml configuration are the same as for the threshold warning level colors described above, except that the fews:colortype field is not applicable here.
In the warninglevels.xml configuration, both a color and a symbold can be specified (optionally), the symbolId can be applied only to <use/> elements in a SVG document where the setup is as follows:
<svg ...>
  <defs>
    <path id="..." d="..." />
    <polyon id="..." points="..." />
  </defs>
  ...
  <use xlink:href="#id" .... />
</svg>The xlink:href attribute will lookup any graphic in the defs section with the given id and embed this in the <use/> element, which can contain transforms, fill and stroke definitions that can be manipulated in other ways at the same time. So by putting the "fill" attributes in the <use/> element, it should be possible to apply both a color and symboId from a ThresholdWarningLevel at the same time.
Tooltip Configuration Options
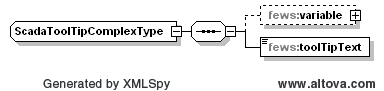
Tooltip configuration elements
variable
The data from this variable is used to replace the tags in the specified toolTip text. If for a given tag the required data is not available, then that tag is replaced by a dash symbol "-". This variable is only required if the specified toolTip text contains tags.
toolTipText
Text that is displayed in the toolTip for this component. See the next section on tags.
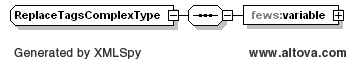
Replace Tags Configuration Options
...
If specified, then the tags in the text of this component are replaced using data from the specified variable. Tags should be separated by "%" signs. Text can be e.g. "Last value = %LASTVALUE(numberFormatId)%", which would be replaced by e.g. "Last value = 10.0". The following tags can be used in the text (numberFormatId/dateFormatId should be replaced by the id of a numberFormat/dateFormat that is defined at the start of this configuration file):
...
%CURRENTTIME(dateFormatId)%
...
the local time of the client.
...
%STARTTIME(dateFormatId)%
...
the start date and time of the relative view period of the time series. Requires the relative view period to be configured.
...
%ENDTIME(dateFormatId)%
...
the end date and time of the relative view period of the time series. Requires the relative view period to be configured.
...
%LASTVALUE(numberFormatId)%
...
the most recent reliable or doubtful value in the time series. In case of enumeration parameter, omit the numberformatId.
...
%LASTVALUETIME(dateFormatId)%
...
the date and time of the most recent reliable or doubtful value in the time series.
...
%LASTVALUECOMMENT()%
...
the comment of the most recent reliable or doubtful value present in given time series array
...
%FIRSTVALUE(numberFormatId)%
...
the first reliable or doubtful value in the time series. In case of enumeration parameter, omit the numberformatId
...
%FIRSTVALUETIME(dateFormatId)%
...
the date and time of the first reliable or doubtful value present in given time series array
...
%FIRSTVALUECOMMENT()%
...
the comment of the first reliable or doubtful value present in given time series array
...
%MINVALUE(numberFormatId)%
...
the minimum reliable or doubtful value in the time series. In case of enumeration parameter, omit the numberformatId.
...
%MAXVALUE(numberFormatId)%
...
the maximum reliable or doubtful value in the time series. In case of enumeration parameter, omit the numberformatId.
...
%EXTERNALFORECASTINGSTARTTIME(dateFormatId)%
...
the start of the external forecast.
...
%MAXTIME(dateFormatId)%
...
the date/time of maximum value found in the time series (occurrence closest to T0).
...
%MINTIME(dateFormatId)%
...
the date/time of minimum value found in the time series (occurrence closest to T0).
...
%TIMEZERO(dateFormatId)%
...
in case of forecast data the forecast time, otherwise timezero.
...
%MAXWARNINGLEVEL(thresholdId)%
...
name of the highest warning level threshold that has been crossed (requires an available thresholdValueSet)
...
%LOCATIONATTRIBUTE(textAttribute)%
%LOCATIONATTRIBUTE(numberAttribute;numberFormat)%
...
attribute to put in text. the numberFormat is intended for number attributes.
...
This option can only be used within the SSD configuration (so not the SVG file itself), and only within the title element of the openDisplay element of leftSingleClickAction and rightSingleClickAction. It is supported since 2017.02
VariableId is intended for the case that multiple variables have been configured.
If no numberFormat is used the tag should be %LOCATIONATTRIBUTE(numberAttribute;;variableId)%.
VariableId is optional if only one variable is configured. At least a locationId or locationSet has to be configured for the variable.
...
.
anchorPointY
The y coordinate of the anchor point. The rotation will be around the anchor point. This y coordinate has to be specified in the user space coordinate system of the svg object for this component in the svg file. The user space coordinate system is determined by all transforms that are specified in the parent svg objects of the svg object for this component. All transforms that are specified in the svg object itself are not part of the user space coordinate system and thus should be taken into account in the coordinates that are specified here. E.g. to rotate a "rect" svg object with attributes width="200" height="200" x="500" y="300" transform="translate(50 0)" around its center, use anchorPoint coordinates (x, y) = (650, 400). See also Determining the rotation anchor point for an SVG object in user space coordinates.
Use Threshold Warning Level Colors Configuration Options
Use threshold warning level colors configuration elements
variable
The data for this variable is used to determine threshold crossings. For crossed thresholds, warningLevels are activated. The color of the most severe activated warningLevel is used as the fill and/or stroke color for the component, as specified below.
thresholdGroupId
Optional. If specified, then only thresholds in the specified thresholdGroup are used in the determination of threshold crossings and warningLevels for the specified variable. If not specified, then thresholds in all thresholdGroups are used.
thresholdReference
Specify which data is used for determining threshold crossings. Either choose the first or last reliable or doubtful value within the relative view period, or choose all reliable or doubtful values within the relative view period. Can be "first_value", "last_value" or "relative_view_period".
colorType
Specify which color type (fill and/or stroke) should be changed to use warningLevel colors. Color types that are not specified here are not changed. Can be "fill", "stroke" or "fill_and_stroke".
Use Threshold Warning Level Symbols Configuration Options
The fields in this xml configuration are the same as for the threshold warning level colors described above, except that the fews:colortype field is not applicable here.
In the warninglevels.xml configuration, both a color and a symbold can be specified (optionally), the symbolId can be applied only to <use/> elements in a SVG document where the setup is as follows:
<svg ...>
  <defs>
    <path id="..." d="..." />
    <polyon id="..." points="..." />
  </defs>
  ...
  <use xlink:href="#id" .... />
</svg>The xlink:href attribute will lookup any graphic in the defs section with the given id and embed this in the <use/> element, which can contain transforms, fill and stroke definitions that can be manipulated in other ways at the same time. So by putting the "fill" attributes in the <use/> element, it should be possible to apply both a color and symboId from a ThresholdWarningLevel at the same time.
Tooltip Configuration Options
Tooltip configuration elements
variable
The data from this variable is used to replace the tags in the specified toolTip text. If for a given tag the required data is not available, then that tag is replaced by a dash symbol "-". This variable is only required if the specified toolTip text contains tags.
toolTipText
Text that is displayed in the toolTip for this component. See the next section on tags.
Replace Tags Configuration Options
| Anchor | ||||
|---|---|---|---|---|
|
If specified, then the tags in the text of this component are replaced using data from the specified variable. Tags should be separated by "%" signs. Text can be e.g. "Last value = %LASTVALUE(numberFormatId)%", which would be replaced by e.g. "Last value = 10.0". The following tags can be used in the text (numberFormatId/dateFormatId should be replaced by the id of a numberFormat/dateFormat that is defined at the start of this configuration file):
%CURRENTTIME(dateFormatId)% | the local time of the client. |
%STARTTIME(dateFormatId)% | the start date and time of the relative view period of the time series. Requires the relative view period to be configured. |
%ENDTIME(dateFormatId)% | the end date and time of the relative view period of the time series. Requires the relative view period to be configured. |
%LASTVALUE(numberFormatId)% | the most recent reliable or doubtful value in the time series. In case of enumeration parameter, omit the numberformatId. |
%LASTVALUETIME(dateFormatId)% | the date and time of the most recent reliable or doubtful value in the time series. |
%LASTVALUECOMMENT()% | the comment of the most recent reliable or doubtful value present in given time series array |
%FIRSTVALUE(numberFormatId)% | the first reliable or doubtful value in the time series. In case of enumeration parameter, omit the numberformatId |
%FIRSTVALUETIME(dateFormatId)% | the date and time of the first reliable or doubtful value present in given time series array |
%FIRSTVALUECOMMENT()% | the comment of the first reliable or doubtful value present in given time series array |
%MINVALUE(numberFormatId)% | the minimum reliable or doubtful value in the time series. In case of enumeration parameter, omit the numberformatId. |
%MAXVALUE(numberFormatId)% | the maximum reliable or doubtful value in the time series. In case of enumeration parameter, omit the numberformatId. |
%EXTERNALFORECASTINGSTARTTIME(dateFormatId)% | the start of the external forecast. |
%MAXTIME(dateFormatId)% | the date/time of maximum value found in the time series (occurrence closest to T0). |
%MINTIME(dateFormatId)% | the date/time of minimum value found in the time series (occurrence closest to T0). |
%TIMEZERO(dateFormatId)% | in case of forecast data the forecast time, otherwise timezero. |
%MAXWARNINGLEVEL(thresholdId)% | name of the highest warning level threshold that has been crossed (requires an available thresholdValueSet) |
%LOCATIONATTRIBUTE(textAttribute)% %LOCATIONATTRIBUTE(numberAttribute;numberFormat)% | attribute to put in text. the numberFormat is intended for number attributes. |
| %LOCATIONATTRIBUTE(numberAttribute;numberFormat;variableId)% | This option can only be used within the SSD configuration (so not the SVG file itself), and only within the title element of the openDisplay element of leftSingleClickAction and rightSingleClickAction. It is supported since 2017.02 VariableId is intended for the case that multiple variables have been configured. If no numberFormat is used the tag should be %LOCATIONATTRIBUTE(numberAttribute;;variableId)%. VariableId is optional if only one variable is configured. At least a locationId or locationSet has to be configured for the variable. |
| %PARAMETERNAME(variableId)% | Since 2017.02. Used to set title in openDisplay leftSingleClickAction and rightS ingleClickAction. Variable is optional if only one variable was configured. |
| Warning |
|---|
The Relative View Period specified in the variables of the Schematic Status Display is always relative to the sliderTime. While moving the slider in the timeNavigator, the sliderTime is used as TimeZero. The choice of Relative View Period is therefore essential for the best behaviour of the Schematic Status Display. For instance, for displaying the time series value at the sliderTime using the LASTVALUE tag, the configured variable should have a Relative View Period with length 0. But for instance when using the click action that opens the TimeSeriesDialog, a separate second variable should be used with a non-zero Relative View Period. |
variable
The data from this variable is used to replace the tags in the text in the svg object that this component refers to. If for a given tag the required data is not available, then that tag is replaced by a dash symbol "-".
...
Variable configuration elements
Choose between a reference to a variable or an embedded definition of a variable.
variableId
Identifier of a variable to use.
locationId
If the specified variable contains multiple locations, then specify the location to use here.
overrulingRelativeViewPeriod
Optional time period for which data should be read. This time period overrules the viewPeriod in the timeSeriesSet of the referenced variable. This time period is relative to the selected display time in this scada display. The start and end of the period are both included. If the start and/or end of the period is not a valid time according to the timeStep of the variable, then the start and/or end is shifted to the previous valid time (e.g. for a period from 15:20 hours to 16:20 hours and a whole hour timeStep the period is shifted to be 15:00 hours to 16:00 hours).
timeSeriesSet
A time series set that can be used as input for a component.
...
Up to 2011_01 it is necessary that all data to be displayed in the ScadaDisplay is beforehand available as time series. This includes simple sums and differences between other time series. From 2011_02 onwards, it is possible to include in the ScadaDisplay configuration one or more transformations. These transformations will make it easier to use derived time series. The derived timeseries will be calculated on-the-fly as temporary timeseries. The transformations are processed in the order they appear in the configuration.
NB. For 2011_02 only the UserSimpleFunction is supported and tested as a transformation that can be used.
Sample configuration for transformations within the ScadaDisplay
NB. It is required that the timeSeriesType of output variables are set to temporary.
This sample will allow the variable with variableId Observation_minus_correction to be displayed on a scadaPanel. This variable refers to a temporary timeseries that will be updated on-the-fly with the difference between the two other variables Observation and Correction.
...
| Code Block | ||||
|---|---|---|---|---|
| ||||
<variable> <variableId>Observation</variableId> <timeSeriesSet> <moduleInstanceId>Afgeleide_Twentekanalen</moduleInstanceId> <valueType>scalar</valueType> <parameterId>H.meting</parameterId> <locationSetId>Hydro_LMW_TK_H</locationSetId> <timeSeriesType>external historical</timeSeriesType> <timeStep unit="hour"/> <relativeViewPeriod unit="hour" start="-1" end="0"/> <readWriteMode>read only</readWriteMode> </timeSeriesSet> </variable> <variable> <variableId>Correction</variableId> <timeSeriesSet> <moduleInstanceId>Afgeleide_Twentekanalen</moduleInstanceId> <valueType>scalar</valueType> <parameterId>H.meting</parameterId> <locationSetId>Hydro_LMW_TK_H</locationSetId> <timeSeriesType>external historical</timeSeriesType> <timeStep unit="hour"/> <relativeViewPeriod unit="hour" start="-1" end="0"/> <readWriteMode>read only</readWriteMode> </timeSeriesSet> </variable> <variable> <variableId>Observation_minus_correction</variableId> <timeSeriesSet> <moduleInstanceId>Afgeleide_Twentekanalen</moduleInstanceId> <valueType>scalar</valueType> <parameterId>H.meting</parameterId> <locationSetId>Hydro_LMW_TK_H</locationSetId> <timeSeriesType>temporary</timeSeriesType> <timeStep unit="hour"/> <relativeViewPeriod unit="hour" start="-1" end="0"/> <readWriteMode>add originals</readWriteMode> <synchLevel>9</synchLevel> </timeSeriesSet> </variable> <transformation id="TransformationObservationMinusCorrection"> <user> <simple> <expression>Observation - Correction</expression> <outputVariable> <variableId>Observation_minus_correction</variableId> </outputVariable> </simple> </user> </transformation> ... |
...