...
| Note |
|---|
Still to document: TimeSpanComplexType |
| Table of Contents |
|---|
...
Intr
oduction
A list of pre-configured displays can be configured in the Display groups. When available on the file system, the name of the XML file is for example: DisplayGroups.xml
...
Since 2020.02 it is possible to automatically pair up the time series based on their configured order: <matchTimeSeriesPair>timeSeriesOrder</matchTimeSeriesPair>
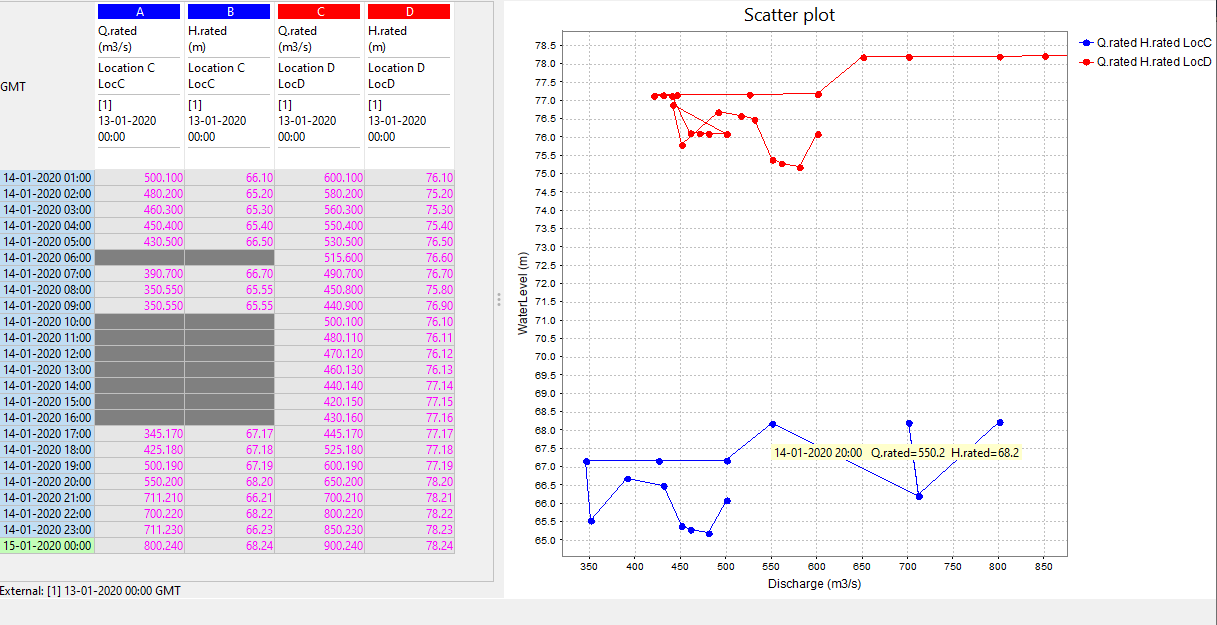
Since 20212020.02 it It is possible to show the date and time of data points on hovering over the dots in the chart and on hovering over the table cells
...
<displayGroup name="ScatterPlotDisplays">
	<display name="ScatterPlot">
		<relativeViewPeriod unit="hour" start="-240" end="0"/>
		<locationId>LocD</locationId>
		<plotId>ScatterPlot</plotId>
		<showAsScatterPlot>
			<referencePoints>
				<point>
					<x>0</x>
					<y>60</y>
				</point>
				<point>
					<x>500</x>
					<y>65</y>
				</point>
				<point>
					<x>1000</x>
					<y>70</y>
				</point>
				<point>
					<x>1500</x>
					<y>75</y>
				</point>
			</referencePoints>
			<xAxisRange>
				<min>0</min>
				<max>1500</max>
			</xAxisRange>
			<yAxisRange>
				<min>60</min>
				<max>75</max>
			</yAxisRange>
		</showAsScatterPlot>
	</display>
</displayGroup>
draw colored areas based on configured points. Also, in the plot, the grid lines in the background and the interaction line are visible, and legends are added next to the plot.
Since 2022.02 the scatter series are shown in standard time series table and all configuration elements are optional , so it is enough to configure <showAsScatterPlot/>.
A simple scatter plot , without any additional option, is shown below :

Since 2020.02 It is possible to draw colored areas based on configured points. Also, in the plot, the grid lines in the background and the interaction line are visible, and legends are added next to the plot. Below is an example of how a coloredBackgroundArea could be configured:
| Code Block |
|---|
<coloredBackgroundArea>
<label>Release Plan Acceptable only if the rainfall event is judged likely to be complete or nearly complete and it is expected the Drain Down Strategy will be selected in the next 12 hours</label>
<color>yellow</color>
<opaquenessPercentage>50</opaquenessPercentage>
<point>
	<x>67</x>
        <y>99</y>
</point>
<point>
	<x>67</x>
	<y>109.7</y>
</point>
<point>
	<x>80</x>
	<y>109.7</y>
</point>
</coloredBackgroundArea> |
The above configuration makes the yellow area in the following example:

statisticalFunctionId to create a preconfigured display
...