...
In between the element <referencePoints> there can be <point> elements defined that will be shown as an interaction line.
With the elements <xAxisRange> and <yAxisRange> the range of the x and y axis can be defined.
By default all time series with the same location are paired up.
Since 2017.02 time series with the same parameter can be paired up by using the element <createPairsByMatchingParameter>true</createPairsByMatchingParameter>
Since 2019.02 it is enabled that when there are only 2 time series they will be paired up irregardless of their location or parameter.
Since 2019.02 The element <markerVisibility> is introduced which enables the possibility the choose whether all data points "all", no data points "none" or only the last data point "onlyLast" should be visualised using a marker
Since 2020.02 it is possible to automatically pair up the time series based on their configured order: <matchTimeSeriesPair>timeSeriesOrder</matchTimeSeriesPair>
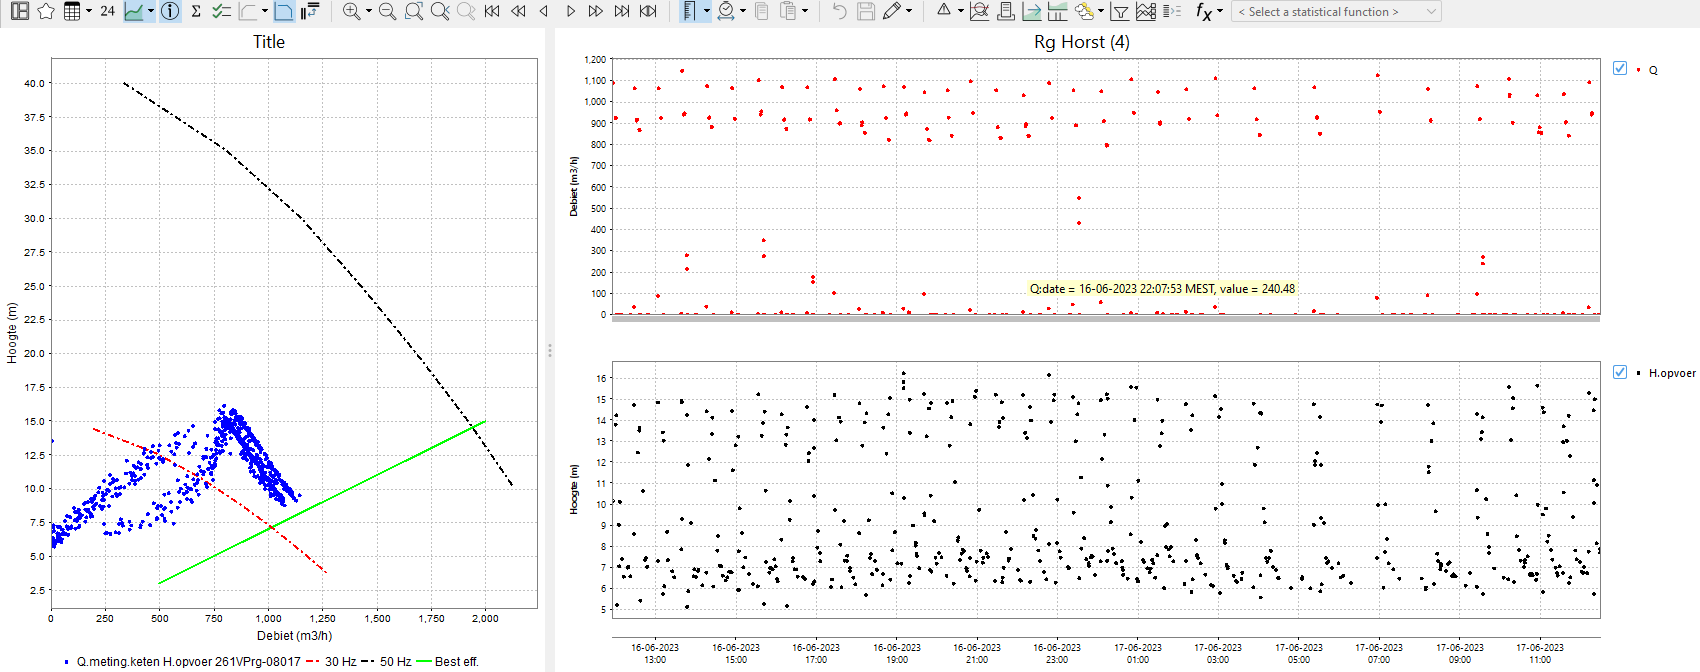
Since 2020.02 It is possible to draw colored areas based on configured points. Also, in the plot, the grid lines in the background and the interaction line are visible, and legends are added next to the plot.
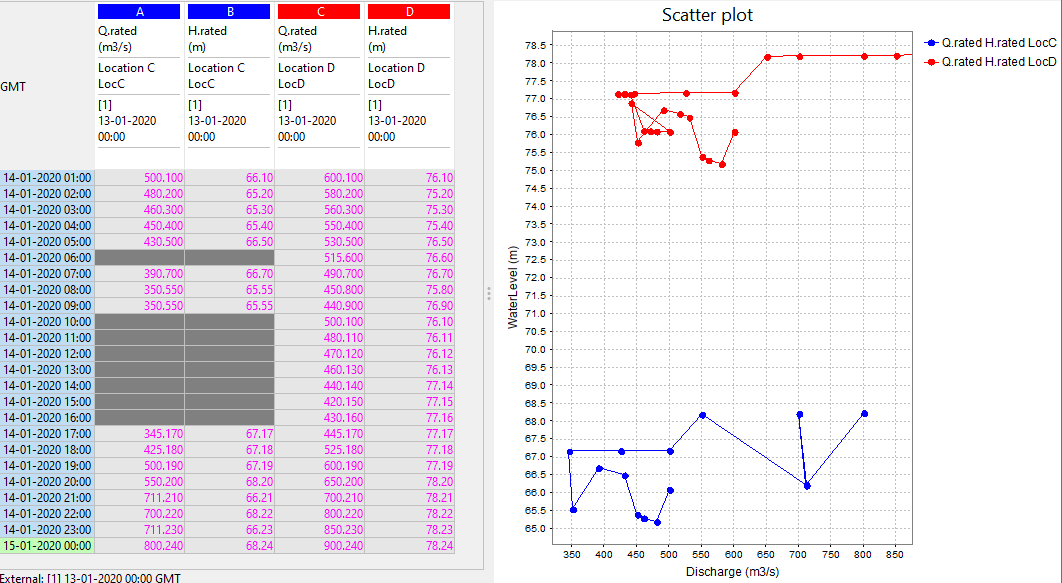
Since 2022.02 the scatter series are shown in standard time series table and all configuration elements are optional , so it is enough to configure <showAsScatterPlot/>.
A simple scatter plot , without any additional options, is shown below :
An example of scatter plot configuration that uses all optional elements:
Reference points can also be configured using multi-value location attrbutes. <xAttributeId> contains the x-coordinates of the points, <yAttributeId> the y-coordinates. Time dependent location attributes are not supported.
Any number of interaction lines can be added to the plot. Lines configured with points or location attributes can be added in any order or combination.
config example:
| Code Block | ||||
|---|---|---|---|---|
| ||||
<referencePoints>
	<xAttributeId>BEP_80_Q</xAttributeId>
	<yAttributeId>BEP_80_H</yAttributeId>
</referencePoints>
<referencePoints>
		<point>
			<x>0</x>
			<y>60</y>
		</point>
		<point>
			<x>500</x>
			<y>60</y>
		</point>
		<point>
			<x>1000</x>
			<y>70</y>
		</point>
		<point>
			<x>1500</x>
			<y>75</y>
		</point>
</referencePoints>
<referencePoints>
	<xAttributeId>Q_50Hz</xAttributeId>
	<yAttributeId>H_50Hz</yAttributeId>
</referencePoints> |
It is also possible to customise the interaction lines. In this case, the <referencePoints> element should be surrounded by <infoPlotLine> element. None of the customisation options within an <infoPlotLine> are compulsory. If you wish to configure several interaction lines, all of them have to be configured either as <infoPlotLine> or as <referencePoints>. You cannot mix <referencePoints> and <infoPlotLine>.
Config example:
| Code Block | ||||
|---|---|---|---|---|
| ||||
				<infoPlotLine>
					<color>red</color>
					<lineStyle>dashdot</lineStyle>
					<labelText>30 Hz</labelText>
					<referencePoints>
						<xAttributeId>Q_30Hz</xAttributeId>
						<yAttributeId>H_30Hz</yAttributeId>
					</referencePoints>
				</infoPlotLine>
				<infoPlotLine>
					<lineStyle>dashdot</lineStyle>
					<lineWidth>2</lineWidth>
					<labelText>50 Hz</labelText>
   					<referencePoints>
						<point>
							<x>0</x>
							<y>60</y>
						</point>
						<point>
							<x>500</x>
							<y>60</y>
						</point>
						<point>
							<x>1000</x>
							<y>70</y>
						</point>
						<point>
							<x>1500</x>
							<y>75</y>
						</point>
					</referencePoints>
				</infoPlotLine>
				<infoPlotLine>
					<color>green</color>
					<lineWidth>2</lineWidth>
					<labelText>Best eff.</labelText>
					<referencePoints>
						<xAttributeId>BEP_80_Q</xAttributeId>
						<yAttributeId>BEP_80_H</yAttributeId>
					</referencePoints>
				</infoPlotLine>
				<infoPlotLine>
					<referencePoints>
						<xAttributeId>Q_50Hz</xAttributeId>
						<yAttributeId>H_50Hz</yAttributeId>
					</referencePoints>
</infoPlotLine> |
If the element <showInSeperateInfoPlot>true</showInSeperateInfoPlot> is set to true, the time series display will show a regular time series, and the scatterplot will only appear if the info plot button is selected. The info plot button has to be enabled in the TieSeriesDisplayConfig.xml buttonsettings.
With the elements <xAxisRange> and <yAxisRange> the range of the x and y axis can be defined.
By default all time series with the same location are paired up.
Since 2017.02 time series with the same parameter can be paired up by using the element <createPairsByMatchingParameter>true</createPairsByMatchingParameter>
Since 2019.02 it is enabled that when there are only 2 time series they will be paired up irregardless of their location or parameter.
Since 2019.02 The element <markerVisibility> is introduced which enables the possibility the choose whether all data points "all", no data points "none" or only the last data point "onlyLast" should be visualised using a marker
Since 2020.02 it is possible to automatically pair up the time series based on their configured order: <matchTimeSeriesPair>timeSeriesOrder</matchTimeSeriesPair>
Since 2020.02 It is possible to draw colored areas based on configured points. Also, in the plot, the grid lines in the background and the interaction line are visible, and legends are added next to the plot.
Since 2022.02 the scatter series are shown in standard time series table and all configuration elements are optional , so it is enough to configure <showAsScatterPlot/>.
A simple scatter plot , without any additional options, is shown below :
An example of scatter plot configuration that uses all optional elements:
| Code Block |
|---|
<showAsScatterPlot>
	<chartTitle>Title</chartTitle>
	<showInSeperateInfoPlot>true</showInSeperateInfoPlot>
	<infoPlotLine>
		<color>red</color>
		<lineStyle>dashdot</lineStyle>
		<lineWidth>2</lineWidth>
		<labelText>30 Hz</labelText>
		<referencePoints>
			<xAttributeId>Q_30Hz</xAttributeId>
			<yAttributeId>H_30Hz</yAttributeId>
		</referencePoints>
	</infoPlotLine>
	<infoPlotLine>
		<color>black</color>
		<lineStyle>dashdot</lineStyle>
		<lineWidth>2</lineWidth>
		<labelText>50 Hz</labelText>
		<referencePoints>
 			<point>
 				<x>10</x>
				<y>40</y>
			</point>
			<point>
				<x>10</x>
				<y>80</y>
|
| Code Block |
<showAsScatterPlot> <chartTitle>Show As Scatter Plot</chartTitle> <referencePoints> <point> <x>0</x> <y>60</y> </point> <point> <x>500< <x>1000</x> <y>60<<y>80</y> </point> <point> <x>1000</x> <y>70< <y>10</y> </point> <point></referencePoints> </infoPlotLine> <infoPlotLine> <x>1500<<color>green</x>color> <y>75</y><lineStyle>solid</lineStyle> <lineWidth>2</lineWidth> </point> <labelText>Best eff.</labelText> <referencePoints> <xAttributeId>BEP_80_Q</xAttributeId> <yAttributeId>BEP_80_H</yAttributeId> </referencePoints> </infoPlotLine> <referencePointsLegendLabel>reference points</referencePointsLegendLabel> <coloredBackgroundArea> <label>area 1</label> <color>cyan</color> <opaquenessPercentage>50</opaquenessPercentage> <point> <x>10</x> <y>40</y> </point> <point> <x>10</x> <y>80</y> </point> <point> <x>1000</x> <y>80</y> </point> <point> <x>1000</x> <y>10</y> </point> </coloredBackgroundArea> <coloredBackgroundArea> <label>area 2</label> <color>green</color> <opaquenessPercentage>50</opaquenessPercentage> <point> <x>100</x> <y>20</y> </point> <point> <x>100</x> <y>70</y> </point> <point> <x>2000</x> <y>20</y> </point> </coloredBackgroundArea> <xAxisRange> <min>-100</min> <max>1600</max> </xAxisRange> <xAxisTitle>X axis title</xAxisTitle> <yAxisRange> <min>40</min> <max>90</max> </yAxisRange> <yAxisTitle>Y axis title</yAxisTitle> <overrulingSeriesLabel>Series 1</overrulingSeriesLabel> <overrulingSeriesLabel>Series 2</overrulingSeriesLabel> <matchTimeSeriesPair>location</matchTimeSeriesPair> <!-- the options are: location, parameter --> <markerVisibility>onlyLast</markerVisibility> <!-- the options are: all, none, onlyLast --> </showAsScatterPlot> |
...