...
A horizontal bar is plotted for each time series. The color of the bars signify the value for that time series at the given time on the x-axis.
| Code Block |
|---|
| language | xml |
|---|
| title | horizontalColorCode example (click to expand) |
|---|
| linenumbers | true |
|---|
| collapse | true |
|---|
| <plot id="HorizontalColorCodePumps">
<description>testing the horizontal color code plots</description>
<subplot>
<subPlotType>horizontalColorCode</subPlotType>
<barMarginPercentage>30</barMarginPercentage>
<classBreaks>
<break lowerValue="0" color="green" label="off"/>
<break lowerValue="1" color="goldenrod" label="1 pump"/>
<break lowerValue="2" color="magenta" label="2 pumps"/>
<break lowerValue="3" color="aquamarine" label="3 pumps"/>
<break lowerValue="4" color="red"/>
</classBreaks>
<timeSeriesSet>
<moduleInstanceId>Preprocess_Units_HTMS</moduleInstanceId>
<valueType>scalar</valueType>
<parameterId>PO_BFN</parameterId>
<locationId>BFN Tower 1</locationId>
<locationId>BFN Tower 2</locationId>
<locationId>BFN Tower 3</locationId>
<locationId>BFN Tower 4</locationId>
<locationId>BFN Tower 5</locationId>
<locationId>BFN Tower 6</locationId>
<locationId>BFN Tower 7</locationId>
<timeSeriesType>simulated forecasting</timeSeriesType>
<timeStep unit="hour" multiplier="1"/>
<readWriteMode>read only</readWriteMode>
</timeSeriesSet>
</subplot>
</plot> |
| 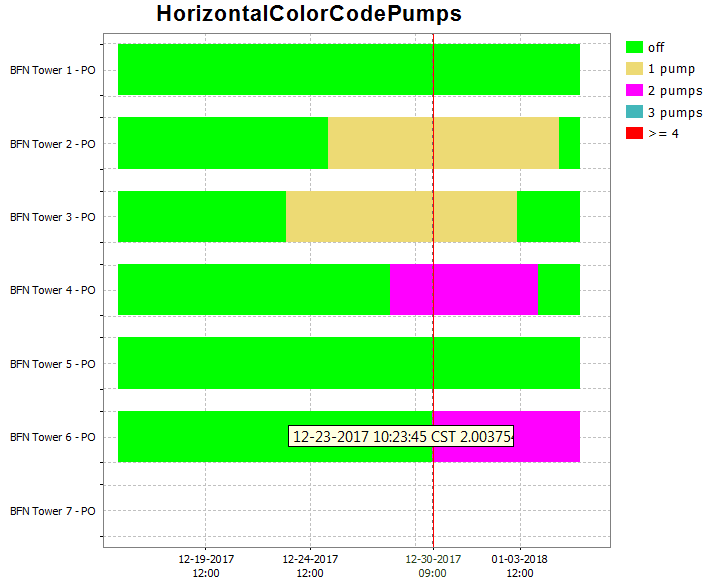 Image Modified Image Modified
|
leftAxis and rightAxis
...
Use the <area> element in combination with a <lineStyle> to obtain vertical lines.
| Code Block |
|---|
| language | xml |
|---|
| title | area example (click to expand) |
|---|
| linenumbers | true |
|---|
| collapse | true |
|---|
| <subplot>
<area>
<lineStyle>solid</lineStyle>
<lineWidth>10</lineWidth>
<color>blue</color>
<opaquenessPercentage>50</opaquenessPercentage>
<timeSeriesSet>
<moduleInstanceId>ImportMSW</moduleInstanceId>
<valueType>scalar</valueType>
<parameterId>Q.m</parameterId>
<locationId>H-MS-LUIK</locationId>
<locationId>H-MS-SINT</locationId>
<timeSeriesType>external historical</timeSeriesType>
<timeStep unit="hour"/>
<relativeViewPeriod unit="day" start="-2" end="0"/>
<readWriteMode>read only</readWriteMode>
</timeSeriesSet>
</area>
</subplot>
|
|  Image Modified Image Modified
|
clusteredBars
This option makes it possible to cluster bars per timestep. The config example below shows how clustered bars are displayed and configured:
| Code Block |
|---|
| language | xml |
|---|
| title | clusteredBars example (click to expand) |
|---|
| linenumbers | true |
|---|
| collapse | true |
|---|
| <displayGroup name="bars">
<display name="clusteredBars">
<subplot>
<clusteredBars axis="left">
<bar>
<color>blue</color>
<visibleInLegend>false</visibleInLegend>
<visibleInPlot>false</visibleInPlot>
<timeSeriesSet>
<moduleInstanceId>Import</moduleInstanceId>
<valueType>scalar</valueType>
<parameterId>H.m</parameterId>
<locationId>LocA</locationId>
<timeSeriesType>external historical</timeSeriesType>
<timeStep unit="hour"/>
<relativeViewPeriod unit="hour" start="-12" end="12"/>
<readWriteMode>editing visible to all future task runs</readWriteMode>
</timeSeriesSet>
</bar>
<bar>
<color>red</color>
<visibleInTable>false</visibleInTable>
<label>Rated Discharge</label>
<timeSeriesSet>
<moduleInstanceId>Import</moduleInstanceId>
<valueType>scalar</valueType>
<parameterId>Q.m</parameterId>
<locationId>LocA</locationId>
<timeSeriesType>external historical</timeSeriesType>
<timeStep unit="hour"/>
<relativeViewPeriod unit="hour" start="-12" end="12"/>
<readWriteMode>editing visible to all future task runs</readWriteMode>
</timeSeriesSet>
</bar>
</clusteredBars>
</subplot>
</display> |
|  Image Modified Image Modified
|
variableLineWidth
Type of plot that can use variable line width's for different graphs. See screenshot below of plot for different ensemble members with different line width's. In this case line width is an indication of the probability of the ensemble member. The sum of probability of all ensemble members at a time is one. Selecting separate ensemble members will mark them with the color black.
...