...
Attribute: id
Elements:
- description
- legendFontSize: Font size of legend
- axis TitleFontSize: Title font size
- tickLableFontSize: tick label font size
- tickTimeStep: to tie ticks to a time step (since 2018.02)
- synchronizeParameterAxis: synchronize the axis range of subplots displaying time series for the same parameter group (since 2018.02)
- visibilityGroup: defines order of the visibility groups in the drop down box (since 2019.02)
- subplot: see below for details
- plotViewerId & tableViewerId: to use alternative viewers for plot or tables
...
Attributes: name and id
Elements:
- description: Optional description
- nodeId
- viewPermission
- editPermission
- locationLoop
- types of display
- display: see below for details
- singleLocationDisplays Single location displays can be used to easily create plots for individual locations. This can either be done for individual locations, or alternatively for a locationSet which will then produce a list of location with their corresponding plot.
- singleParentLocationDisplays
- displayGroup: see below for details
- Adds multiple displays at once, each showing the children and parent for one parent location.
- displayGroupId (since 2023.01) include a displayGroup defined elsewhere by referencing the id. displayGroupId
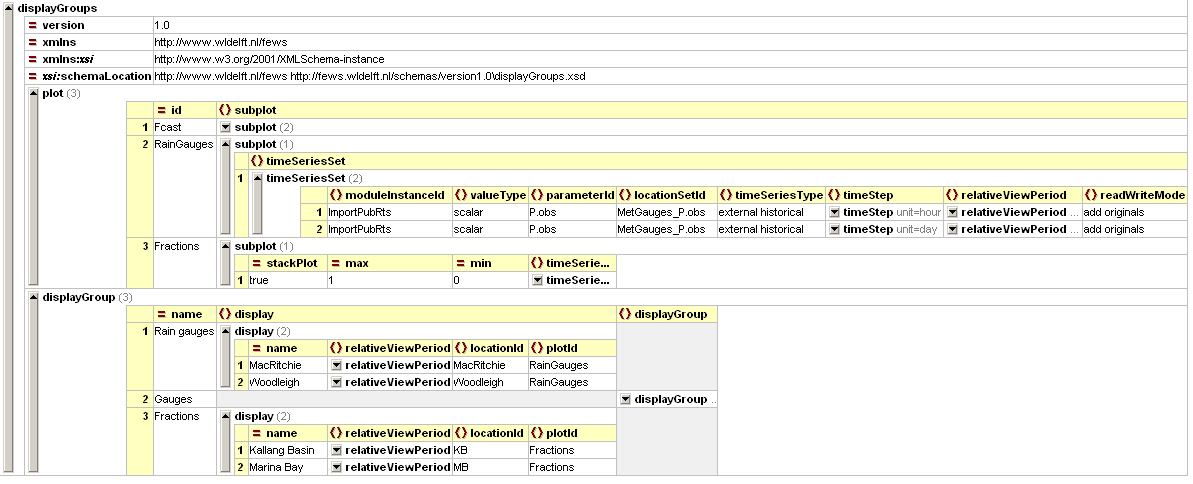

Figure 3 - example of a configured displayGroup file (click to enlarge)
Figure 4 Root element of the display groups definition
...