...
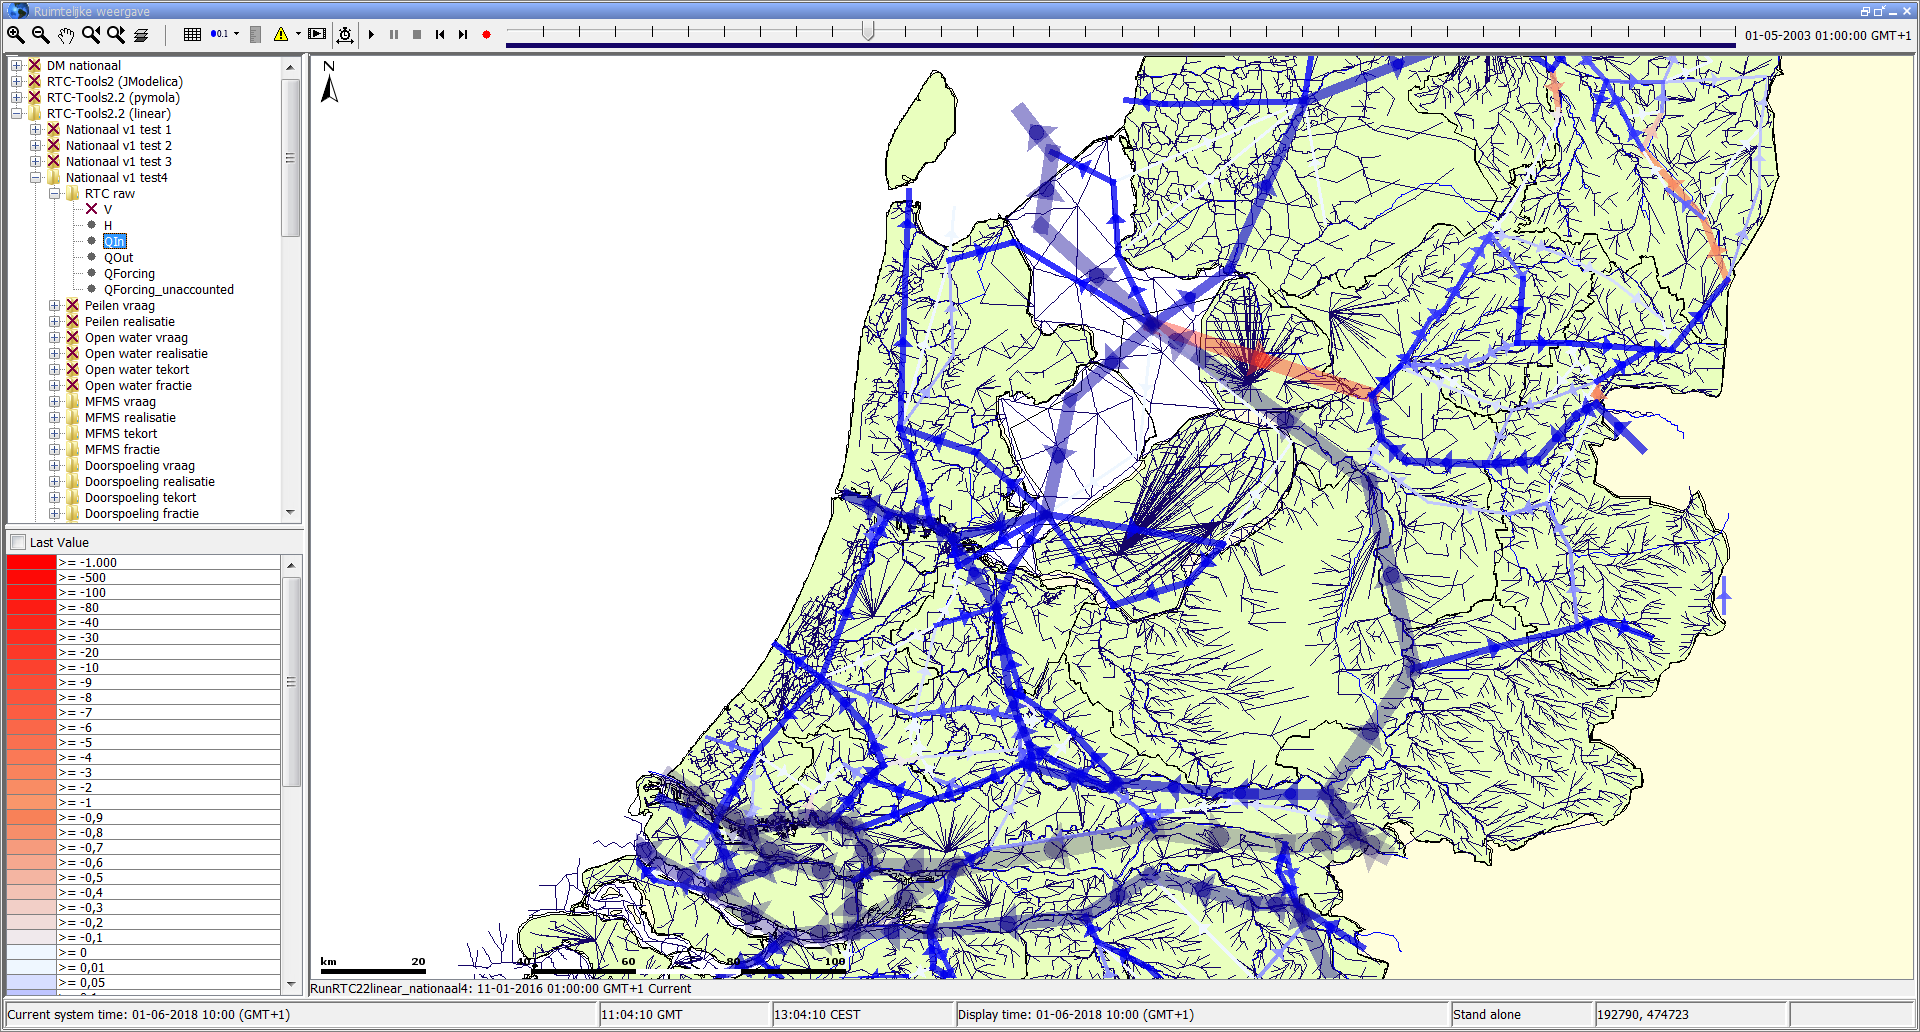
This element is available since 2018.01, in combination with a dataLayer containing a timeSeriesSet element. If this is set to true (false by default) and the locationSet in the timeSeriesSet contains (poly)-lines, the lines drawn in the spatial display will include directional arrows. If the time series has a positive value for a line, the arrow will point from the start of the line (first point found in the shape file) to the end of the line (second point found in the shape file). If the value is negative, the arrow is inverted. See the figures for examples.

symbolSvg
Since 2024.02. Instead of the circle symbol an custom svg can be configured. Every layer / time series set can have it's own symbol. The svg should only use the color black. The svg is automatically resized to the active symbol size.

| Code Block | ||
|---|---|---|
| ||
<dataLayer>
	<symbolSvg>triangle.svg</symbolSvg> <!--	from Config/IconFiles-->
	<timeSeriesSet>
		<moduleInstanceId>DummyImport</moduleInstanceId>
		<valueType>scalar</valueType>
		<parameterId>H.m</parameterId>
		<locationId>SX.E7842</locationId>
		<timeSeriesType>external historical</timeSeriesType>
		<timeStep unit="hour"/>
		<readWriteMode>read complete forecast</readWriteMode>
	</timeSeriesSet>
</dataLayer> |
| Code Block | ||
|---|---|---|
| ||
<?xml version="1.0"?>
<svg width="10" height="10" viewBox="0 0 10 10" xmlns="http://www.w3.org/2000/svg" version="1.1">
	<polygon points="0,10 5,0 10,10" fill="black"/>
</svg> |
wmsLayer
Use this option to show an animated wms layer which will be downloaded from a WMS server.
...
Definition of colors to use in displaying the dynamic grid. These are also shown in the legend on the left of the grid display (see example elsewhere on this page). Optional when default class breaks are available for this plot group and parameter group.
Figure 145 Elements of the configuration of class breaks
Classbreaks can also be configured in the TimeSeriesDisplayConfig.xml file . If this functionality is used, a reference to the classBreakId is required. When using the Deft-FEWS Web-OC, all classbreaks need to be configured this way otherwise no legend is shown in the WMS layer of the spatial display.
<classBreaksId>rainfall</classBreaksId>
description
Optional description. Since FEWS 2017.01 it is allowed to have multiple class breaks for a plot. The user can switch between the class breaks with a drop down list. This description is used in the drop down list.
...