...
| Code Block |
|---|
| language | xml |
|---|
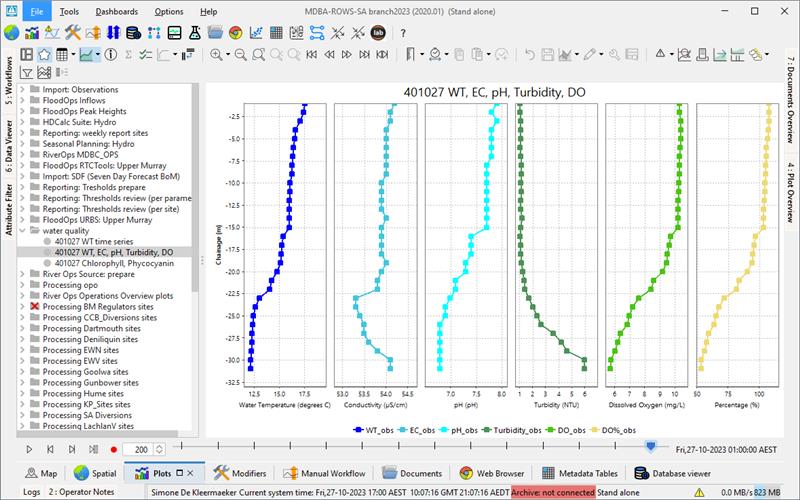
| title | showAsVerticalProfile example (click to expand) |
|---|
| linenumbers | true |
|---|
| collapse | true |
|---|
| <plot id="waterQuality">
<subplot>
<line>
<color>blue</color>
<lineStyle>solid;thick</lineStyle>
<markerStyle>square</markerStyle>
<timeSeriesSet>
<moduleInstanceId>ProcessObservedWaterquality</moduleInstanceId>
<valueType>scalar</valueType>
<parameterId>WT_obs</parameterId>
<locationId>R_401027</locationId>
<timeSeriesType>external historical</timeSeriesType>
<timeStep unit="hour" multiplier="3"/>
<readWriteMode>read only</readWriteMode>
</timeSeriesSet>
</line>
</subplot>
<subplot>
<line>
<color>turquoise</color>
<lineStyle>solid;thick</lineStyle>
<markerStyle>square</markerStyle>
<timeSeriesSet>
<moduleInstanceId>ProcessObservedWaterquality</moduleInstanceId>
<valueType>scalar</valueType>
<parameterId>EC_obs</parameterId>
<locationId>R_401027</locationId>
<timeSeriesType>external historical</timeSeriesType>
<timeStep unit="hour" multiplier="3"/>
<readWriteMode>read only</readWriteMode>
</timeSeriesSet>
</line>
</subplot>
<subplot>
<line>
<color>cyan</color>
<lineStyle>solid;thick</lineStyle>
<markerStyle>square</markerStyle>
<timeSeriesSet>
<moduleInstanceId>ProcessObservedWaterquality</moduleInstanceId>
<valueType>scalar</valueType>
<parameterId>pH_obs</parameterId>
<locationId>R_401027</locationId>
<timeSeriesType>external historical</timeSeriesType>
<timeStep unit="hour" multiplier="3"/>
<readWriteMode>read only</readWriteMode>
</timeSeriesSet>
</line>
</subplot>
<subplot>
<line>
<color>forest green</color>
<lineStyle>solid;thick</lineStyle>
<markerStyle>square</markerStyle>
<timeSeriesSet>
<moduleInstanceId>ProcessObservedWaterquality</moduleInstanceId>
<valueType>scalar</valueType>
<parameterId>Turbidity_obs</parameterId>
<locationId>R_401027</locationId>
<timeSeriesType>external historical</timeSeriesType>
<timeStep unit="hour" multiplier="3"/>
<readWriteMode>read only</readWriteMode>
</timeSeriesSet>
</line>
</subplot>
<subplot>
<line>
<color>green3</color>
<lineStyle>solid;thick</lineStyle>
<markerStyle>square</markerStyle>
<timeSeriesSet>
<moduleInstanceId>ProcessObservedWaterquality</moduleInstanceId>
<valueType>scalar</valueType>
<parameterId>DO_obs</parameterId>
<locationId>R_401027</locationId>
<timeSeriesType>external historical</timeSeriesType>
<timeStep unit="hour" multiplier="3"/>
<readWriteMode>read only</readWriteMode>
</timeSeriesSet>
</line>
</subplot>
<subplot>
<line>
<color>goldenrod</color>
<lineStyle>solid;thick</lineStyle>
<markerStyle>square</markerStyle>
<timeSeriesSet>
<moduleInstanceId>ProcessObservedWaterquality</moduleInstanceId>
<valueType>scalar</valueType>
<parameterId>DO%_obs</parameterId>
<locationId>R_401027</locationId>
<timeSeriesType>external historical</timeSeriesType>
<timeStep unit="hour" multiplier="3"/>
<readWriteMode>read only</readWriteMode>
</timeSeriesSet>
</line>
</subplot>
</plot>
<displayGroup id="waterquality" name="water quality">
<display id="WQ_R_401027" name="401027 WT, EC, pH, Turbidity, DO">
<relativeViewPeriod unit="hour" start="-336" end="168"/>
<locationId>R_401027</locationId>
<plotId>waterQuality</plotId>
<showAsVerticalProfile>true</showAsVerticalProfile>
</display>
</displayGroup>
|
| |
classbreaks or classbreak id
It's possible to configure classbreaks for vertical profile time series. If they are configured, in the time series dropdown menu a "Use color map" button will become visible.
Config example:
| Code Block |
|---|
| language | xml |
|---|
| linenumbers | true |
|---|
|
	<plot id="waterTemperatureVerticalProfile">
		<subplot>
			<line>
				<color>blue</color>
				<lineStyle>solid;thick</lineStyle>
				<markerStyle>square</markerStyle>
				<timeSeriesSet>
					<moduleInstanceId>ProcessObservedWaterquality</moduleInstanceId>
					<valueType>scalar</valueType>
					<parameterId>WT_obs</parameterId>
					<locationId>R_401027</locationId>
					<timeSeriesType>external historical</timeSeriesType>
					<timeStep unit="hour" multiplier="3"/>
					<readWriteMode>read only</readWriteMode>
				</timeSeriesSet>
			</line>
			<classBreaksId>WaterTemperature</classBreaksId>
		</subplot>
		<subplot>
			<line>
				<color>turquoise</color>
				<lineStyle>solid;thick</lineStyle>
				<markerStyle>square</markerStyle>
				<timeSeriesSet>
					<moduleInstanceId>ProcessObservedWaterquality</moduleInstanceId>
					<valueType>scalar</valueType>
					<parameterId>EC_obs</parameterId>
					<locationId>R_401027</locationId>
					<timeSeriesType>external historical</timeSeriesType>
					<timeStep unit="hour" multiplier="3"/>
					<readWriteMode>read only</readWriteMode>
				</timeSeriesSet>
			</line>
			<classBreaks>
				<break lowerValue="2" color="green"/>
				<break lowerValue="3" color="dark sea green"/>
			</classBreaks>
</subplot> |
 Image Added
  Image Added
showAsScatterPlot
To plot time series, with the values of the different time series on the X and Y axis. - <referencePoints> can be defined in several ways:
- <point> will be shown as an interaction line.
- <xAttributeId>, <yAttributeId> defining the x and y coordinates of the points, the y-coordinates.
Time dependent location attributes are not supported.
- <interactionLine>
- Any number of interaction lines can be added to the plot.
- Lines configured with points or location attributes can be added in any order or combination.
- You can customise the interaction lines.
In this case, the <referencePoints> element should be surrounded by <interactionLine> element. - None of the customisation options within an <interactionLine> are compulsory.
- With multiple interaction lines, all should be configured as either interactionLine or referencePoints.
You cannot mix <referencePoints> and <interactionLine>
| Example from operational system 
|
...